s the velocity and fric

Refrigeration and Air Conditioning Technology (MindTap Course List)
8th Edition
ISBN:9781305578296
Author:John Tomczyk, Eugene Silberstein, Bill Whitman, Bill Johnson
Publisher:John Tomczyk, Eugene Silberstein, Bill Whitman, Bill Johnson
Chapter50: Commercial, Packaged Rooftop, Variable Refrigerant Flow, And Variable Air Volume Systems
Section: Chapter Questions
Problem 15RQ: Explain why the outside air damper is typically never completely closed, even when the outside air...

Related questions
Question
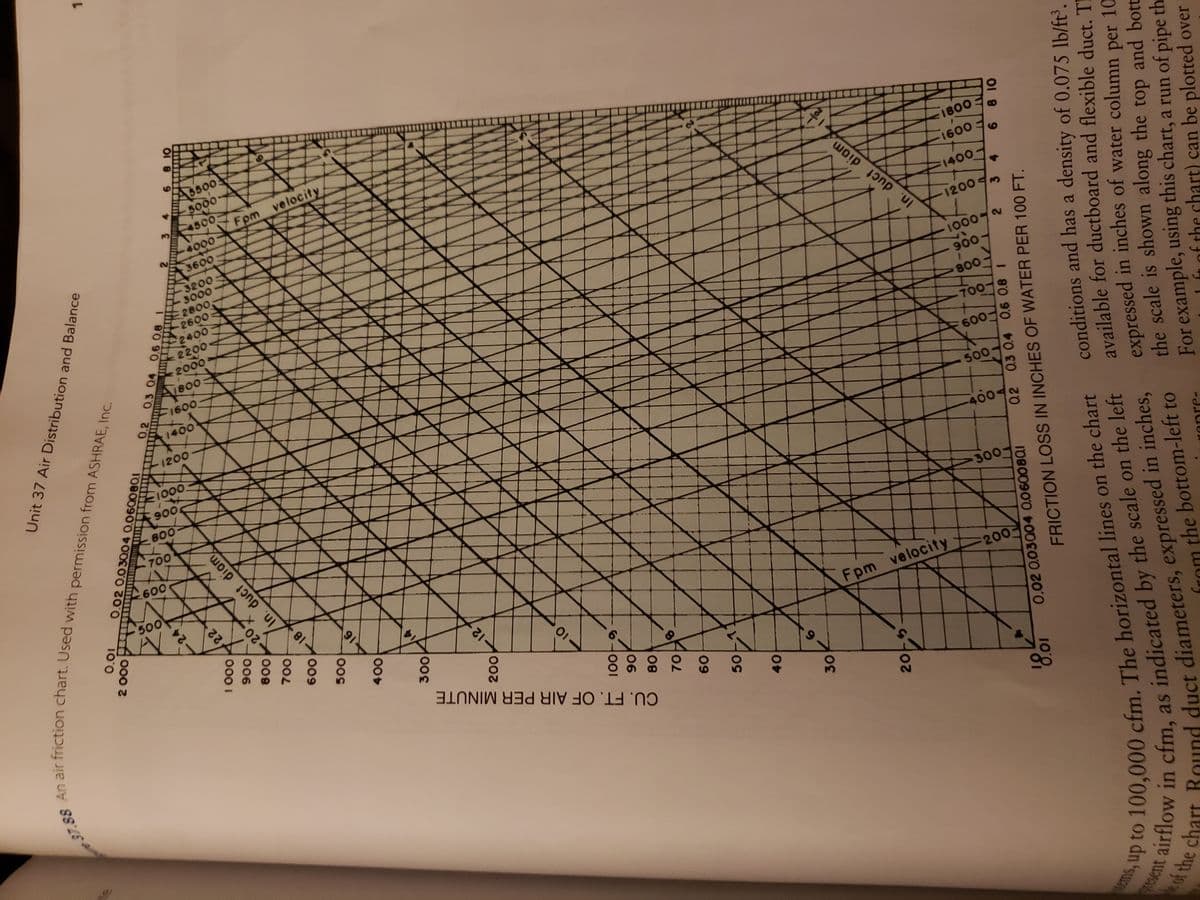
Using the chart in figure 37.88, what is the velocity and friction loss of a 400 company airstream that is flowing through a 9 inch round duct?
Transcribed Image Text:Ass00
5000
500
Fpm velocity
4000
3600
-3200
3000
E 2800
2600
2400
OL 2200
2000
A1B00
F1600
7-
In. duct diom
1400
1200
1000-N
600
500
3004
30
CU. FT. OF AIR PER MINUTE
Fpm velocity
200
ms, up to The lines on chart
of Bound duct in inches,
Unit 37 Air Distribution and Balance
0.02 0.03004 0.060080I
100
000 2
24
22
000 I
0.2 0.3 04 0,6 0.8 I
20
006
In. duct diam,
008
18
009
1.
000
12
01
06
09
40
2아
10'0
0.02 0.03004 0.06008Q1
Sento 100,000 cfm. The horizontal lines on the chart
airflow in cfm,
of the chart
818888
02 03 0.4 0.6 0.8 I
FRICTION LOSS IN INCHES OF WATER PER 100 FT.
as indicated by the scale on the left
34
conditions and has a density of 0.075 lb/ft³.
available for ductboard and flexible duct. TI
expressed in inches of water column per 10
the scale is shown along the top and bott
For example, using this chart, a run of pipe
from the bottom-left to
re-
he chart) can be plotted over
Expert Solution
This question has been solved!
Explore an expertly crafted, step-by-step solution for a thorough understanding of key concepts.

This is a popular solution!

Trending now
This is a popular solution!

Step by step
Solved in 2 steps with 1 images

Knowledge Booster


Learn more about
Need a deep-dive on the concept behind this application? Look no further. Learn more about this topic, mechanical-engineering and related others by exploring similar questions and additional content below.Recommended textbooks for you
Refrigeration and Air Conditioning Technology (Mi…
Mechanical Engineering
ISBN:
9781305578296
Author:
John Tomczyk, Eugene Silberstein, Bill Whitman, Bill Johnson
Publisher:
Cengage Learning
Refrigeration and Air Conditioning Technology (Mi…
Mechanical Engineering
ISBN:
9781305578296
Author:
John Tomczyk, Eugene Silberstein, Bill Whitman, Bill Johnson
Publisher:
Cengage Learning