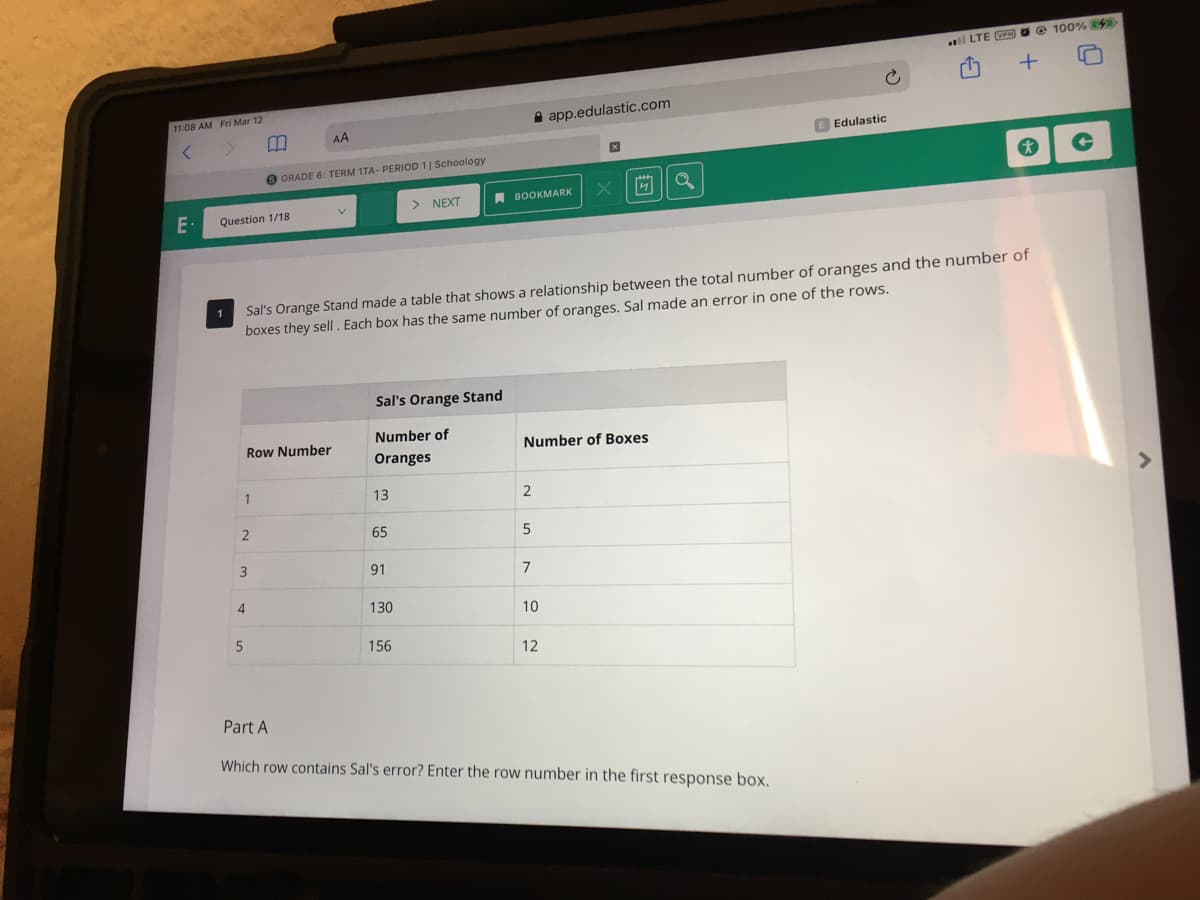
Sal's Orange Stand made a table that shows a relationship between the total number of oranges and the number of boxes they sell. Each box has the same number of oranges. Sal made an error in one of the rows. Sal's Orange Stand Number of Row Number Number of Boxes Oranges 1 13 65 3 91 7 4. 130 10 156 12 Part A Which row contains Sal's error? Enter the row number in the first response box. 2.
Q: At Center Hospital there is some concern about the high turnover of nurses. A survey was done to…
A: Given Box and whisker plot is IQR=?
Q: PRACTICE ANOTHER Are customers more loyal in the East or in the West? The following table is based…
A: "Since you have posted a question with multiple subparts, we will solve first 3 sub-parts for you.…
Q: In 2009, the New York Yankees won 103 baseball games during the regular season. The table on the…
A: The correlation matrix is given below y x1 x2 y 1 x1 -0.64 1 x2 0.5881 0.0978 1
Q: 4. A researcher is interested in whether daily positive affirmations can lead to positive academic…
A: In testing of hypothesis, there are two hypotheses - null and alternative. The null hypothesis must…
Q: The boxplot below shows salaries for Construction workers and Teachers. Construction Teacher 20 25…
A: In general boxplot shows five number summary, which are minimum, first quartile, median, third…
Q: A movie critic reviewed 36 films. 12 were documentaries and 24 were feature films. She got favorable…
A: Given information- We have given that a movie reviewed 36 films. In 36 films, 12 were documentaries…
Q: A student did a survey on the age of marriage for married male and female students. Use the…
A: Given data set is:
Q: Scenario: A researcher believes that elementary school teachers who are womer earn less than their…
A: Given: Female Sample size = 100 Sample standard deviation = 1000 Male Sample size = 225 Sample…
Q: A person’s educational attainment and age group was collected by the U.S. Census Bureau in 1984 to…
A: Given Data : 25-34 35-44 45-54 55-64 >64 Total Did not Complete HS 5416 5030 5777 7606…
Q: a) In a private school students can choose only of French, Spanish or Music as their Elective. In a…
A:
Q: Suppose that you are taking a course where the total class grade is the weighted average of your…
A:
Q: 1. Determine the correlation between variables (if it exists) in this relation. Which variable is…
A: The data shows the the percentage of GDP that a country spends on health expenditures ("Health…
Q: A school nurse wants to determine whether age is a factor in whether children choose a healthy snack…
A: Null hypothesis: There is no relationship between age and selection of healthy snack. Alternative…
Q: The band at Hawthorne Middle School consists of students in the sixth, seventh, and eighth grades.…
A: Q Total number of students in the school band
Q: Does role at a University affect one’s willingness to be vaccinated? The partial results of a survey…
A: Introduction: Consider a frequency distribution given in a two-way contingency table, with the rows…
Q: Fortune magazine publishes an annual list of 100 best companies to work for. The data in the…
A: Since you have submitted the question with multiple subparts, we will solve first 3 subparts for…
Q: 6. A movie critic reviewed 36 films. 12 were documentaries and 24 were feature films. She got…
A: Films Count Favorable reviews Unfavorable reviews Documentaries 12 8 12-8=4 Feature films 24…
Q: Cooling down with a cold drink before exercise in the heat is believed to help an athlete perform.…
A: 98% CI = -d ± tα,n-1*S/n At 98% confidence, tα,n-1 = 2.82
Q: . The result is statistically significant at .05 level of significance. There is not enough…
A: The hypothesis are H0 : Educational attainment and age are not independent H1…
Q: Heights of WOMEN in the U.S. are normally distributed. Recent information shows: Adult women…
A: Given- Heights of WOMEN in the U.S. are normally distributed. Recent information shows: Adult women…
Q: A real estate major collected information on some recent local home sales. The first 6 lines of the…
A: Introduction: Designed surveys and experiments are two of the most commonly used methods of data…
Q: A plant biologist conducted an experiment to compare the yields of 4 varieties of peanuts (A, B, C,…
A: a) Since there are two blocking factors i.e. row and column, the most appropriate design for the…
Q: Walter is a sales manager for a chain of car dealerships. He encourages the managers at each store…
A: Option D will be the right answer.
Q: Aidan is a goalie for his school’s hockey team. He normally stops 87% of the shots that come his…
A:
Q: The course credit hours and grades for a student's fall semester at college are given in the table…
A: Calculate the total grade point and devide by total credit hours.
Q: The data below represent the responses to two questions asked in a survey of 40 college students…
A:
Q: The boxplot below shows salaries for CPAS and Actuaries in a town. CPA Actuary 25 30 35 40 45 50 55…
A: From the boxplot of CPA, the value of median salary for CPA is = 45From the boxplot of Actuary, the…
Q: 7. A movie critic reviewed 36 films. 12 were documentaries and 24 were feature films. She got…
A: Given that , Number of movie critic reviewed = 36 films. Number of documentation =12 Number of…
Q: The data below represent the responses to two questions asked in a survey of 40 college students…
A:
Q: a. Givé a practical interpretation of the coefficient of determination, r. Choose the correct answer…
A: Option B) is correct. R-square shows the total variation explained in the dependent variable by the…
Q: Fill in the Venn Diagram using the data below. (5 points)In a survey of 100 restaurants, it was…
A:
Q: The table shows the worldwide box office (in billions of dollars) for the movie industry during the…
A: Consider the figure given below :
Q: Suppose that you are taking a course where the total class grade is the weighted average of your…
A:
Q: The data below represent the responses to two questions asked in a survey of 40 college students…
A: As there are 2 parts and students want only b part to answer, So, providing the solution of this…
Q: A national nursing organization is lobbying congress for sunding to hire more nurses nationwide. One…
A: From the given information, the sample values are 43, 45, 48, 41, 45, 50, 50, 53, 48
Q: A student did a survey on the age of marriage for married male and female students. Use the…
A: The table shows the age of marriage for married male and female students.
Q: 5.53 TV News Source and Gender (Example 14) A 2018 Pew Research Center report asked people who got…
A: We have been give the data on the types of TV channel versus the sex of the person. Here we need to…
Q: marizes a data set regarding views on full-body scans and political affiliation. The olitical group…
A: The row and column totals are, The formula for calculating the expected counts is, (a) The number…
Q: The following crosstabulation summarizes the data for two categorical variables, x and y. The…
A:
Q: aitlyn has to determine how many of the 120 employees in her work place has comprehensive car…
A: Caitlyn has to determine how many of the 120 employees in her work place has comprehensive car…
Q: An instructor has given a short quiz consisting of two parts. For a randomly selected student, let X…
A: Given information: X|Y 0 5 10 15 Total 0 2 6 2 10 20 5 4 15 20 10 49 10 1 15 14 1 31…
Q: A researcher wants to determine if there is a relationship between having been to college and…
A: Hello! As you have posted 2 different questions, we are answering the first question. In case you…
Q: An administrative assistant for the athletics department at a local university is moni- toring the…
A:
Q: A study has been done to determine to see if the level of education determines how often people move…
A: We have the formula : P(A∪B)=P(A)+P(B)-P(A∩B) So, P( High school Diploma OR lived in 1 state)=P(High…
Q: The data below represent the responses to two questions asked in a survey of 40 college students…
A: It is given that the gender M denotes male and F denotes female.
Q: e boxplot below shows salaries for Construction workers and Teachers. Construction Teacher 24 25 26…
A: NOTE: As per the guidelines, we are supposed to solve the first question only. Please repost the…
Q: The table shows the worldwide box office (in billions of dollars) for the movie industry during the…
A:
Q: Cecil has blue, red, green, and black pens in his bag. This table shows how many of each type of pen…
A: Given that, Cecil has blue, red, green, and black pens in his bag. The table shows that how many of…
Q: The National Collegiate Athletic Association (NCAA) requires colleges to report the graduation rates…
A:
Q: The data below represent the responses to two questions asked in a survey of 40 college students…
A:
Trending now
This is a popular solution!
Step by step
Solved in 2 steps
- If the value of Cronbach’s alpha is 0.07, it means ___________; a. Research instrument is not reliable b. Research instrument is internally consistent c. Data is reliable d. Data is internally consistentThe article “Effect of Varying Solids Concentration and Organic Loading on the Performance of Temperature Phased Anaerobic Digestion Process” (S. Vandenburgh and T. Ellis, Water Environment Research, 2002:142–148) discusses experiments to determine the effect of the solids concentration on the performance of treatment methods for wastewater sludge. In the first experiment, the concentration of solids (in g/L) was 43.94 ± 1.18. In the second experiment, which was independent of the first, the concentration was 48.66 ± 1.76. Estimate the difference in the concentration between the two experiments, and find the uncertainty in the estimate.Researchers interested in lead exposure due to car exhaust sampled the blood of 52 police officers subjected to constant inhalation of automobile exhaust fumes while working traffic enforcement in a primarily urban environment. The blood samples of these officers had an average lead concentration of 124.32 µg/l and a SD of 37.74 µg/l; a previous study of individuals from a nearby suburb, with no history of exposure, found an average blood level concentration of 35 µg/l. Test the hypothesis that the downtown police officers have a higher lead exposure than the group in the previous study. Interpret your results in context. Based on your preceding result, without performing a calculation, would a 99% confidence interval for the average blood concentration level of police officers contain 35 µg/l? Based on your preceding result, without performing a calculation, would a 99% confidence interval for this difference contain 0? Explain why or why not.
- A golf tee manufacturer used a robot to hit balls off of their tee and a competitor's tee using the same club. Assume that 101balls were hit off each tee, and the data are suitable for inference. Is there evidence that balls hit off the manufacturer's tee have a higher initial velocity? (Assume a significance level of 0.05.) Distance (yards) Distance (yards) Ball Velocity (mph) Ball Velocity (mph) Club Velocity (mph) Club Velocity (mph) Avg. SD Avg. SD Avg. SD Competition 220.05 2.02 124.11 0.85 90.82 0.44 Manufacturer 222.28 2.57 125.37 0.41 90.82 0.44 a) Compute the t-statistic. t=_____ (Round to three decimal places as needed.) b)Compute the P-Value P-Value=_____ (Round to three decimal places as needed.)A professor at the University of Iowa was interested in evaluating whether domestic dispute calls were more dangerous to officers than other types of calls. Collecting information on call for service and whether the call resulted in officer injury. The data is displayed in the contingency table below Using an alpha level of 0.05, are domestic calls more dangerous for officers than other types of calls? Compute Cramer’s V and identify if it is a small, medium, or large effectThe Turbine Oil Oxidation Test (TOST) and the Rotating Bomb Oxidation Test (RBOT) are two different procedures for evaluating the oxidation stability of steam turbine oils. An article reported the accompanying observations on x = TOST time (hr) and y = RBOT time (min) for 12 oil specimens. TOST 4200 3600 3750 3650 4050 2770 RBOT 370 345 375 315 350 205 TOST 4870 4525 3450 2700 3750 3325 RBOT 400 380 285 220 345 290 (a) Calculate the value of the sample correlation coefficient. (Round your answer to four decimal places.) r = Carry out a test of hypotheses to decide whether RBOT Time and TOST time are linearly related. (Use ? = 0.05.) Calculate the test statistic and determine the P-value. (Round your test statistic to two decimal places and your P-value to three decimal places.) t = P-value =
- A series of tests of fire prevention sprinkler systems that use a foaming agent to quell the fire were performed to determine how long it took (in seconds) for the sprinklers to be activated after the detection of a fire by the system. The system has been designed so that the true average activation time is supposed to be at most 25 seconds. Do the data strongly indicate that the design specifications have not been met? The data for the test are given below: 27 41 22 27 23 35 30 33 24 27 28 22 24Researchers interested in lead exposure due to car exhaust sampled the blood of 52 police officers subjected to constant inhalation of automobile exhaust fumes while working traffic enforcement in a primarily urban environment. The blood samples of these officers had an average lead concentration of 124.32 µg/l and an SD of 37.74 µg/l; a previous study of individuals from a nearby suburb, with no history of exposure, found an average blood level concentration of 35 µg/l. Write down the hypotheses that would be appropriate for testing if the police officers appear to have been exposed to a higher concentration of lead. Explicitly state and check all conditions necessary for inference on these data. Test the hypothesis that the downtown police officers have a higher lead exposure than the group in the previous study. Interpret your results in context. Based on your preceding result, without performing a calculation, would a 99% confidence interval for the average blood concentration…