sampled weekly to check the performance quality of the department. To establish a entative norm for the department, one sample of 1000 units was collected each week for 10 weeks, with these results: Sample Sample Size Number of Forms with Error Week-1 1000 74 Week-2 1000 42 Week-3 64 Week-4 84 40 50 1000 1000 Week-5 1000 Week-6 1000 Week-7 1000 Week-8 1000 Week-9 1000 Week-10 1000 10000 65 66 40 75 600 1) Develop upper and lower control limits for p-Chart using a 99.7% confidence nterval. ) Is the process under control? Why yes? Why Not?
sampled weekly to check the performance quality of the department. To establish a entative norm for the department, one sample of 1000 units was collected each week for 10 weeks, with these results: Sample Sample Size Number of Forms with Error Week-1 1000 74 Week-2 1000 42 Week-3 64 Week-4 84 40 50 1000 1000 Week-5 1000 Week-6 1000 Week-7 1000 Week-8 1000 Week-9 1000 Week-10 1000 10000 65 66 40 75 600 1) Develop upper and lower control limits for p-Chart using a 99.7% confidence nterval. ) Is the process under control? Why yes? Why Not?

Practical Management Science
6th Edition
ISBN:9781337406659
Author:WINSTON, Wayne L.
Publisher:WINSTON, Wayne L.
Chapter2: Introduction To Spreadsheet Modeling
Section: Chapter Questions
Problem 20P: Julie James is opening a lemonade stand. She believes the fixed cost per week of running the stand...

Related questions
Question
100%
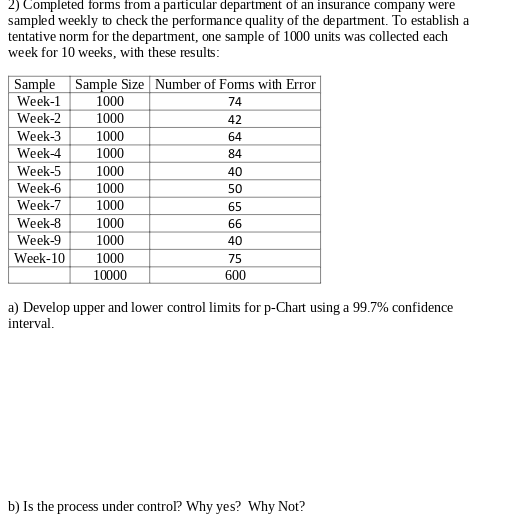
Transcribed Image Text:2) Completed forms from a particular department of an insurance company were
sampled weekly to check the performance quality of the department. To establish a
tentative norm for the department, one sample of 1000 units was collected each
week for 10 weeks, with these results:
Sample Sample Size Number of Forms with Error
Week-1
74
Week-2
1000
1000
Week-3
1000
Week-4 1000
Week-5
1000
Week-6
1000
Week-7
1000
Week-8 1000
Week-9
1000
Week-10 1000
10000
42
64
84
40
50
65
66
40
75
600
a) Develop upper and lower control limits for p-Chart using a 99.7% confidence
interval.
b) Is the process under control? Why yes? Why Not?
Expert Solution
This question has been solved!
Explore an expertly crafted, step-by-step solution for a thorough understanding of key concepts.

Step by step
Solved in 3 steps

Follow-up Questions
Read through expert solutions to related follow-up questions below.
Follow-up Question
Why didn't you use the [SQRT(Pbar(1-Pbar))/n] formula?
Solution
Recommended textbooks for you
Practical Management Science
Operations Management
ISBN:
9781337406659
Author:
WINSTON, Wayne L.
Publisher:
Cengage,

Operations Management
Operations Management
ISBN:
9781259667473
Author:
William J Stevenson
Publisher:
McGraw-Hill Education

Operations and Supply Chain Management (Mcgraw-hi…
Operations Management
ISBN:
9781259666100
Author:
F. Robert Jacobs, Richard B Chase
Publisher:
McGraw-Hill Education
Practical Management Science
Operations Management
ISBN:
9781337406659
Author:
WINSTON, Wayne L.
Publisher:
Cengage,
Operations Management
Operations Management
ISBN:
9781259667473
Author:
William J Stevenson
Publisher:
McGraw-Hill Education
Operations and Supply Chain Management (Mcgraw-hi…
Operations Management
ISBN:
9781259666100
Author:
F. Robert Jacobs, Richard B Chase
Publisher:
McGraw-Hill Education


Purchasing and Supply Chain Management
Operations Management
ISBN:
9781285869681
Author:
Robert M. Monczka, Robert B. Handfield, Larry C. Giunipero, James L. Patterson
Publisher:
Cengage Learning

Production and Operations Analysis, Seventh Editi…
Operations Management
ISBN:
9781478623069
Author:
Steven Nahmias, Tava Lennon Olsen
Publisher:
Waveland Press, Inc.