Selected hypothetical financial data of Target and Wal-Mart for 2022 are presented here (in millions). Target Corporation Wal-Mart Stores, Inc. Income Statement Data for Year Net sales $66,100 $411,000 Cost of goods sold 44,000 302,000 Selling and administrative expenses 15,400 81,000 Interest expense 660 2,100 Other income (expense) (70 ) (420 ) Income tax expense 1,400 7,300 Net income $ 4,570 $ 18,180 Balance Sheet Data (End of Year) Current assets $17,000 $49,000 Noncurrent assets 26,800 120,000 Total assets $43,800 $169,000 Current liabilities $12,000 $54,000 Long-term debt 17,600 45,000 Total stockholders' equity 14,200 70,000 Total liabilities and stockholders' equity $43,800 $169,000 Beginning-of-Year Balances Total assets $43,000 $162,000 Total stockholders' equity 14,400 66,000 Current liabilities 10,600 57,000 Total liabilities 28,600 96,000
Selected hypothetical financial data of Target and Wal-Mart for 2022 are presented here (in millions). Target Corporation Wal-Mart Stores, Inc. Income Statement Data for Year Net sales $66,100 $411,000 Cost of goods sold 44,000 302,000 Selling and administrative expenses 15,400 81,000 Interest expense 660 2,100 Other income (expense) (70 ) (420 ) Income tax expense 1,400 7,300 Net income $ 4,570 $ 18,180 Balance Sheet Data (End of Year) Current assets $17,000 $49,000 Noncurrent assets 26,800 120,000 Total assets $43,800 $169,000 Current liabilities $12,000 $54,000 Long-term debt 17,600 45,000 Total stockholders' equity 14,200 70,000 Total liabilities and stockholders' equity $43,800 $169,000 Beginning-of-Year Balances Total assets $43,000 $162,000 Total stockholders' equity 14,400 66,000 Current liabilities 10,600 57,000 Total liabilities 28,600 96,000

Intermediate Accounting: Reporting And Analysis
3rd Edition
ISBN:9781337788281
Author:James M. Wahlen, Jefferson P. Jones, Donald Pagach
Publisher:James M. Wahlen, Jefferson P. Jones, Donald Pagach
Chapter22: Accounting For Changes And Errors.
Section: Chapter Questions
Problem 4RE: Refer to RE22-2. Assume Heller Company had sales revenue of 510,000 in 2019 and 650,000 in 2020....

Related questions
Question
I need help solving this question.
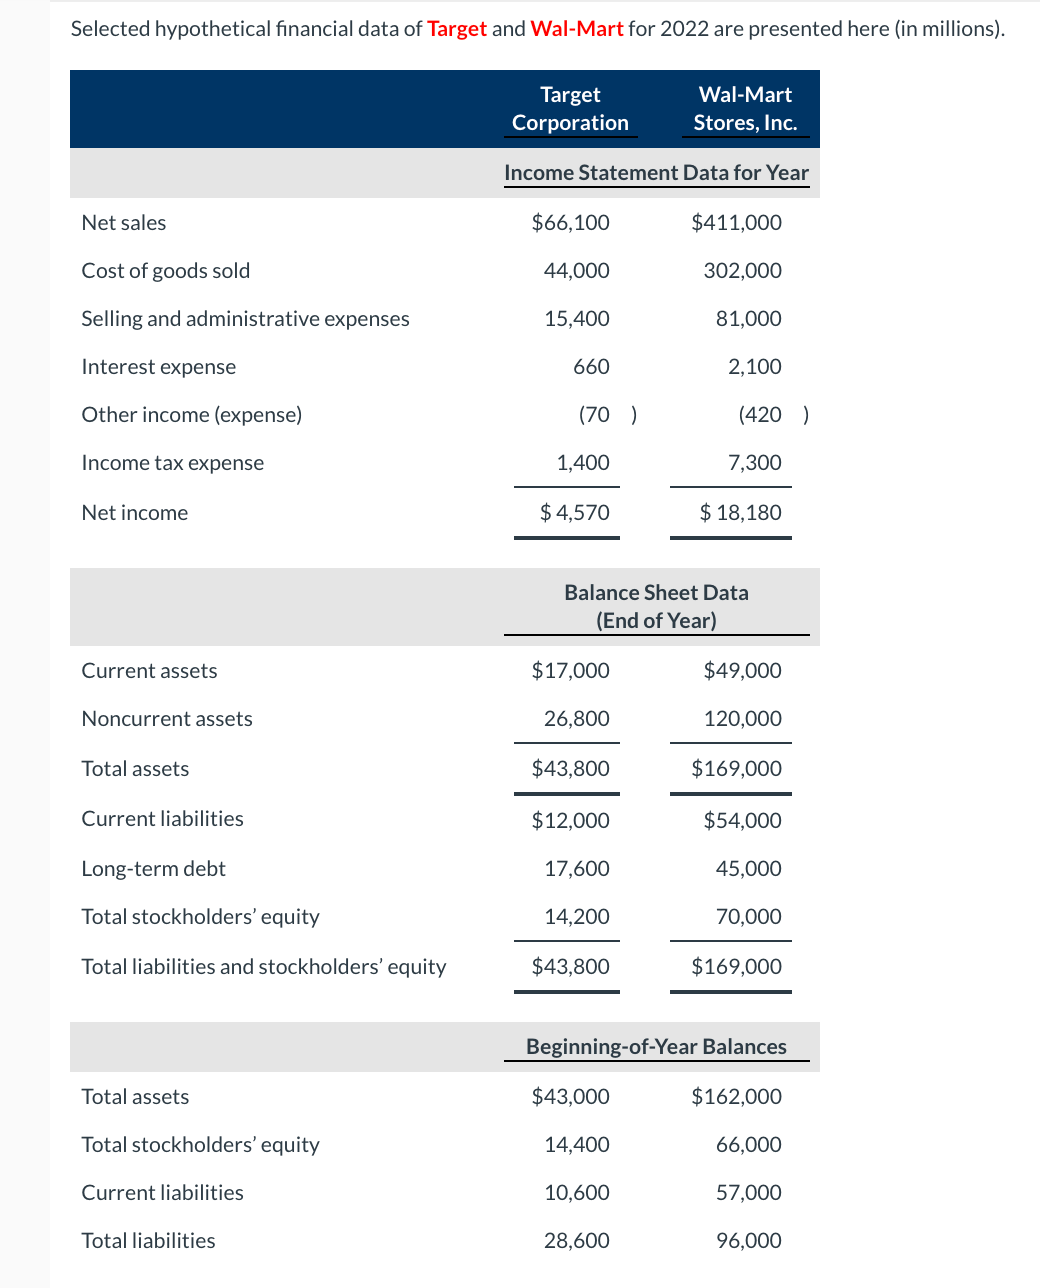
Transcribed Image Text:Selected hypothetical financial data of Target and Wal-Mart for 2022 are presented here (in millions).
Target
Wal-Mart
Corporation
Stores, Inc.
Income Statement Data for Year
Net sales
$66,100
$411,000
Cost of goods sold
44,000
302,000
Selling and administrative expenses
15,400
81,000
Interest expense
660
2,100
Other income (expense)
(70 )
(420 )
Income tax expense
1,400
7,300
Net income
$ 4,570
$ 18,180
Balance Sheet Data
(End of Year)
Current assets
$17,000
$49,000
Noncurrent assets
26,800
120,000
Total assets
$43,800
$169,000
Current liabilities
$12,000
$54,000
Long-term debt
17,600
45,000
Total stockholders' equity
14,200
70,000
Total liabilities and stockholders' equity
$43,800
$169,000
Beginning-of-Year Balances
Total assets
$43,000
$162,000
Total stockholders' equity
14,400
66,000
Current liabilities
10,600
57,000
Total liabilities
28,600
96,000
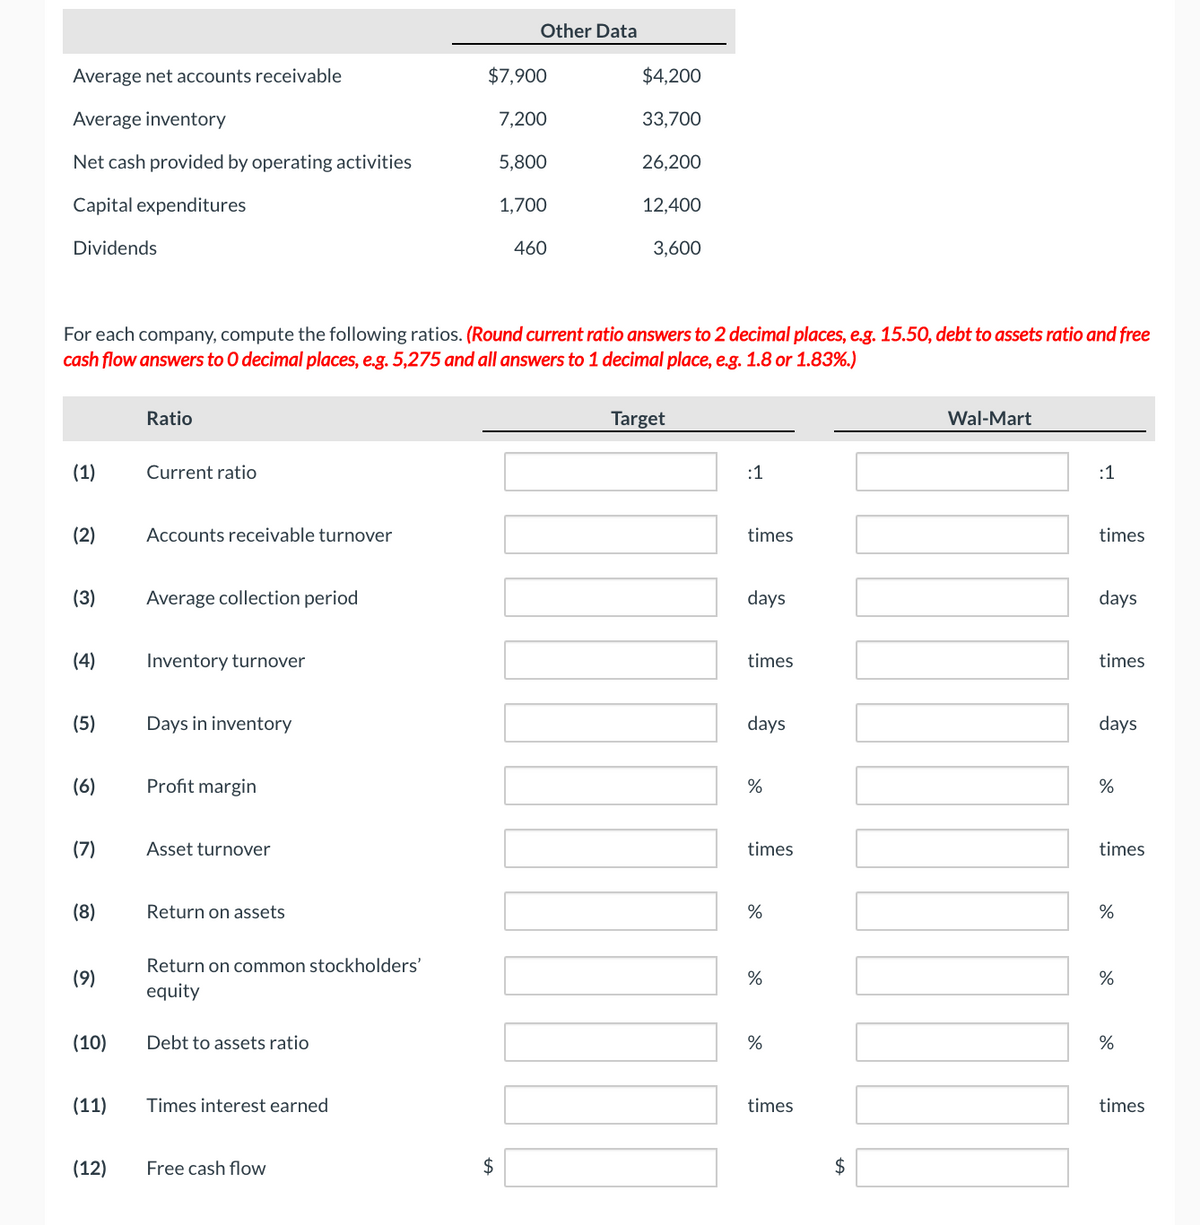
Transcribed Image Text:Other Data
Average net accounts receivable
$7,900
$4,200
Average inventory
7,200
33,700
Net cash provided by operating activities
5,800
26,200
Capital expenditures
1,700
12,400
Dividends
460
3,600
For each company, compute the following ratios. (Round current ratio answers to 2 decimal places, e.g. 15.50, debt to assets ratio and free
cash flow answers to O decimal places, e.g. 5,275 and all answers to 1 decimal place, e.g. 1.8 or 1.83%.)
Ratio
Target
Wal-Mart
(1)
Current ratio
:1
:1
(2)
Accounts receivable turnover
times
times
(3)
Average collection period
days
days
(4)
Inventory turnover
times
times
(5)
Days in inventory
days
days
(6)
Profit margin
%
(7)
Asset turnover
times
times
(8)
Return on assets
%
%
Return on common stockholders'
(9)
equity
(10)
Debt to assets ratio
%
(11)
Times interest earned
times
times
(12)
Free cash flow
2$
Expert Solution
This question has been solved!
Explore an expertly crafted, step-by-step solution for a thorough understanding of key concepts.

This is a popular solution!

Trending now
This is a popular solution!

Step by step
Solved in 2 steps with 3 images

Knowledge Booster


Learn more about
Need a deep-dive on the concept behind this application? Look no further. Learn more about this topic, accounting and related others by exploring similar questions and additional content below.Recommended textbooks for you
Intermediate Accounting: Reporting And Analysis
Accounting
ISBN:
9781337788281
Author:
James M. Wahlen, Jefferson P. Jones, Donald Pagach
Publisher:
Cengage Learning

Fundamentals of Financial Management (MindTap Cou…
Finance
ISBN:
9781337395250
Author:
Eugene F. Brigham, Joel F. Houston
Publisher:
Cengage Learning

Intermediate Accounting: Reporting And Analysis
Accounting
ISBN:
9781337788281
Author:
James M. Wahlen, Jefferson P. Jones, Donald Pagach
Publisher:
Cengage Learning
Fundamentals of Financial Management (MindTap Cou…
Finance
ISBN:
9781337395250
Author:
Eugene F. Brigham, Joel F. Houston
Publisher:
Cengage Learning
