Show complete solution Plot the graph of y(t)=3-2x(-2t-1) by transforming the graph of x(t)
Show complete solution Plot the graph of y(t)=3-2x(-2t-1) by transforming the graph of x(t)

Chapter5: Exponential And Logarithmic Functions
Section: Chapter Questions
Problem 39CT: The population P (in millions) of Texas from 2001 through 2014 can be approximated by the model...

Related questions
Question
100%
Show complete solution
Plot the graph of y(t)=3-2x(-2t-1) by transforming the graph of x(t).
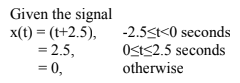
Transcribed Image Text:Given the signal
x(t) = (t+2.5),
= 2.5,
= 0,
-2.5<t<0 seconds
Ost<2.5 seconds
otherwise
Expert Solution
This question has been solved!
Explore an expertly crafted, step-by-step solution for a thorough understanding of key concepts.

This is a popular solution!

Trending now
This is a popular solution!

Step by step
Solved in 3 steps with 1 images

Knowledge Booster


Learn more about
Need a deep-dive on the concept behind this application? Look no further. Learn more about this topic, advanced-math and related others by exploring similar questions and additional content below.Recommended textbooks for you