Shown to the right is a certain population, in billions, for seven selected years from 1950 through 2007. Using a graphing utility's logistic regression option, we obtain the logistic growth model shown below for population, f(x), in billions, x years after 1949. How well does the function model the data for 2007? 11.17 f(x) = 1 +3.39 e -0.028x For 2007, the function accurately predicts the population to one decimal place. slightly underestimates slightly overestimates x, Number of Years after 1949 1 (1950) 11 (1960) 21 (1970) 31 (1980) 41 (1990) 51 (2000) 58 (2007) y, Population (billions) 2.7 3.1 3.8 4.6 5.4 6.2 6.6
Shown to the right is a certain population, in billions, for seven selected years from 1950 through 2007. Using a graphing utility's logistic regression option, we obtain the logistic growth model shown below for population, f(x), in billions, x years after 1949. How well does the function model the data for 2007? 11.17 f(x) = 1 +3.39 e -0.028x For 2007, the function accurately predicts the population to one decimal place. slightly underestimates slightly overestimates x, Number of Years after 1949 1 (1950) 11 (1960) 21 (1970) 31 (1980) 41 (1990) 51 (2000) 58 (2007) y, Population (billions) 2.7 3.1 3.8 4.6 5.4 6.2 6.6

Chapter6: Exponential And Logarithmic Functions
Section6.8: Fitting Exponential Models To Data
Problem 3TI: Table 6 shows the population, in thousands, of harbor seals in the Wadden Sea over the years 1997 to...

Related questions
Question
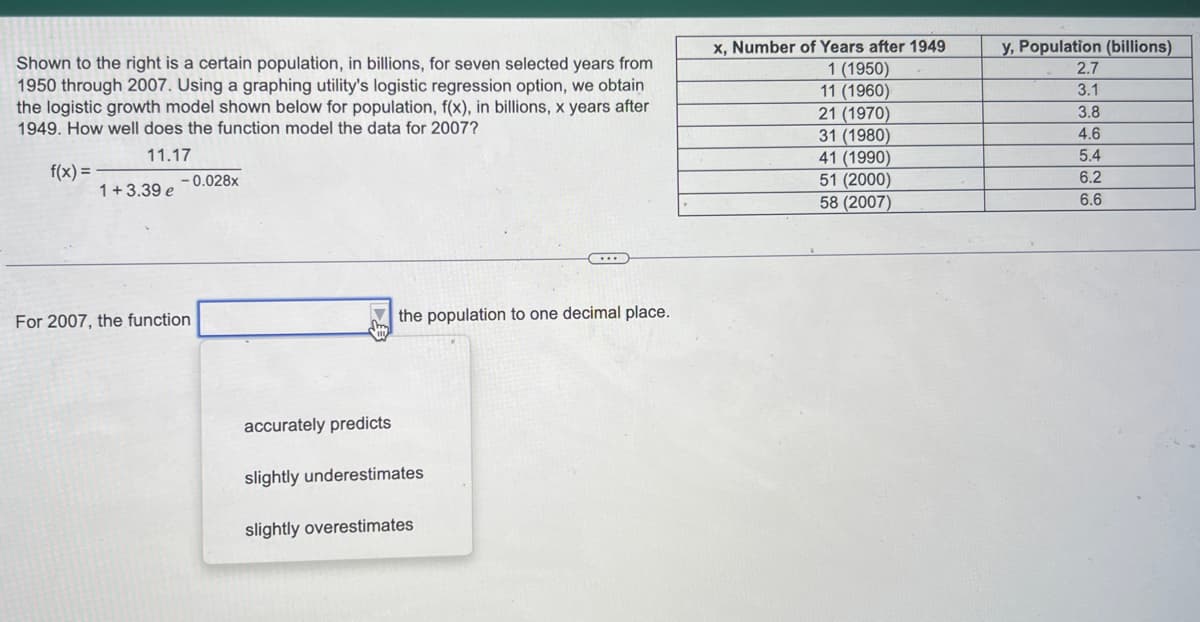
Transcribed Image Text:Shown to the right is a certain population, in billions, for seven selected years from
1950 through 2007. Using a graphing utility's logistic regression option, we obtain
the logistic growth model shown below for population, f(x), in billions, x years after
1949. How well does the function model the data for 2007?
11.17
f(x) =
1 +3.39 e
-0.028x
For 2007, the function
accurately predicts
the population to one decimal place.
slightly underestimates
slightly overestimates
x, Number of Years after 1949
1 (1950)
11 (1960)
21 (1970)
31 (1980)
41 (1990)
51 (2000)
58 (2007)
y, Population (billions)
2.7
3.1
3.8
4.6
5.4
6.2
6.6
Expert Solution
This question has been solved!
Explore an expertly crafted, step-by-step solution for a thorough understanding of key concepts.

Step by step
Solved in 2 steps with 2 images

Recommended textbooks for you

Linear Algebra: A Modern Introduction
Algebra
ISBN:
9781285463247
Author:
David Poole
Publisher:
Cengage Learning

Algebra & Trigonometry with Analytic Geometry
Algebra
ISBN:
9781133382119
Author:
Swokowski
Publisher:
Cengage
Linear Algebra: A Modern Introduction
Algebra
ISBN:
9781285463247
Author:
David Poole
Publisher:
Cengage Learning
Algebra & Trigonometry with Analytic Geometry
Algebra
ISBN:
9781133382119
Author:
Swokowski
Publisher:
Cengage