Shown to the right is a scatter plot that indicates a relationship between the percentage of adult females in a country who are literate and the mortality of children under five (per thousand) Also shown is a line that passes through or near the points. Find a linear function that models the data by finding the slope-intercept form of the line's equation. Use the function to make a prediction about child mortality based on the percentage of adult females in a country who are literate. 60 1391 700 Percent of Literate Adult Females Using the indicated points on the graph of the line, find the slope-intercept form of the line's equation Use the percentage of adult females who are literate as the X-value. f(X) = (Use integers or decimals for any numbers in the equation.)
Shown to the right is a scatter plot that indicates a relationship between the percentage of adult females in a country who are literate and the mortality of children under five (per thousand) Also shown is a line that passes through or near the points. Find a linear function that models the data by finding the slope-intercept form of the line's equation. Use the function to make a prediction about child mortality based on the percentage of adult females in a country who are literate. 60 1391 700 Percent of Literate Adult Females Using the indicated points on the graph of the line, find the slope-intercept form of the line's equation Use the percentage of adult females who are literate as the X-value. f(X) = (Use integers or decimals for any numbers in the equation.)

Glencoe Algebra 1, Student Edition, 9780079039897, 0079039898, 2018
18th Edition
ISBN:9780079039897
Author:Carter
Publisher:Carter
Chapter1: Expressions And Functions
Section1.8: Interpreting Graphs Of Functions
Problem 1GP

Related questions
Question
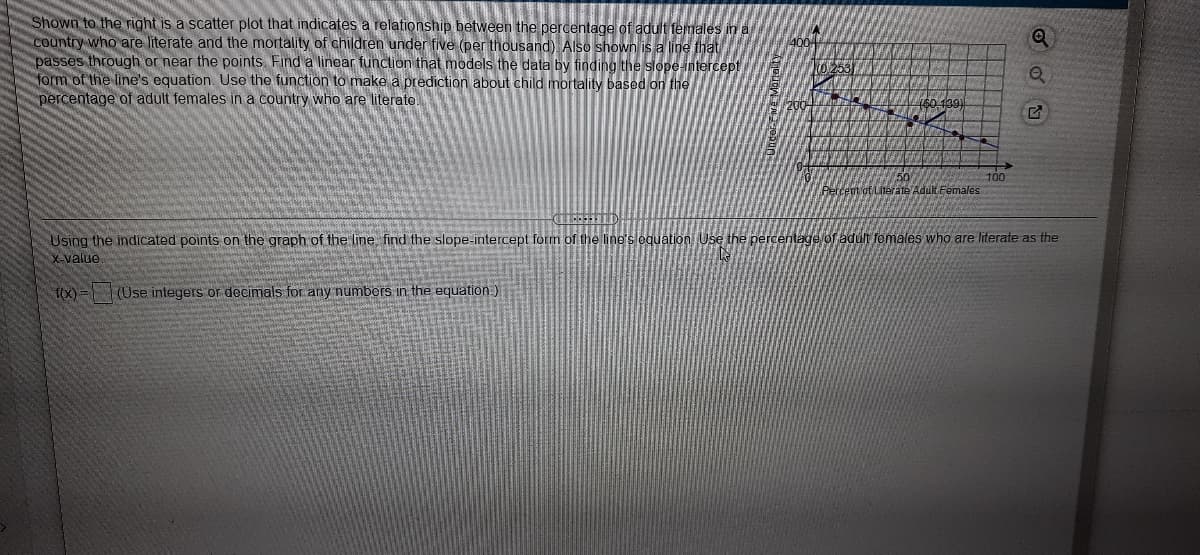
Transcribed Image Text:Shown to the right is a scatter plot that indicates a relationship between the percentage of adult females in a
country who are literate and the mortality of children under five (per thousand) Also shown is a line that
passes through or near the points. Find a linear function that models the data by finding the slope-intercept
form of the line's equation. Use the function to make a prediction about child mortality based on the
percentage of adult females in a country who are literate.
60 1391
100
Percent of Literate Adult Females
Using the indicated points on the graph of the line, find the slope-intercept form of the line's equation Use the percentage of adult females who are literate as the
X-value.
f(X) =
(Use integers or decimals for any numbers in the equation.)
Expert Solution
This question has been solved!
Explore an expertly crafted, step-by-step solution for a thorough understanding of key concepts.

This is a popular solution!

Trending now
This is a popular solution!

Step by step
Solved in 2 steps with 1 images

Recommended textbooks for you
Glencoe Algebra 1, Student Edition, 9780079039897…
Algebra
ISBN:
9780079039897
Author:
Carter
Publisher:
McGraw Hill


Algebra and Trigonometry (MindTap Course List)
Algebra
ISBN:
9781305071742
Author:
James Stewart, Lothar Redlin, Saleem Watson
Publisher:
Cengage Learning
Glencoe Algebra 1, Student Edition, 9780079039897…
Algebra
ISBN:
9780079039897
Author:
Carter
Publisher:
McGraw Hill
Algebra and Trigonometry (MindTap Course List)
Algebra
ISBN:
9781305071742
Author:
James Stewart, Lothar Redlin, Saleem Watson
Publisher:
Cengage Learning

College Algebra
Algebra
ISBN:
9781305115545
Author:
James Stewart, Lothar Redlin, Saleem Watson
Publisher:
Cengage Learning

Holt Mcdougal Larson Pre-algebra: Student Edition…
Algebra
ISBN:
9780547587776
Author:
HOLT MCDOUGAL
Publisher:
HOLT MCDOUGAL

Algebra: Structure And Method, Book 1
Algebra
ISBN:
9780395977224
Author:
Richard G. Brown, Mary P. Dolciani, Robert H. Sorgenfrey, William L. Cole
Publisher:
McDougal Littell