Simon Company's year-end balance sheets follow. At December 31 2017 2016 2015 Assets $ 25,796 $ 30,153 $ 30,486 62,200 83,000 7,915 186,258 Cash Accounts receivable, net Merchandise inventory Prepaid expenses 89,300 112,500 8,307 50,700 57,000 3,387 160,327 Plant assets, net 192,747 Total assets $ 428,650 $ 369,526 $ 301,900 Liabilities and Equity Accounts payable Long-term notes payable secured by mortgages on plant assets Common stock, $10 par value Retained earnings $ 108,869 $ 63,699 $ 40,648 82,198 162,500 75,083 86,691 162,500 56,636 68,054 162,500 30,698 Total liabilities and equity $ 428,650 $ 369,526 $ 301,900 ecember 31, The company's income statements credit: the years ende 2016, follow. A all sales ar oi For Year Ended December 31 2017 2016 Sales $ 557,245 $ 439,736 Cost of goods sold Other operating expenses Interest expense $ 339,919 172,746 9,473 7,244 $ 285,828 111,253 10,114 6,596 Income taxes Total costs and expenses 529,382 413,791 Net income $ 27,863 $ 25,945 Earnings per share $ 1.71 1.60
Simon Company's year-end balance sheets follow. At December 31 2017 2016 2015 Assets $ 25,796 $ 30,153 $ 30,486 62,200 83,000 7,915 186,258 Cash Accounts receivable, net Merchandise inventory Prepaid expenses 89,300 112,500 8,307 50,700 57,000 3,387 160,327 Plant assets, net 192,747 Total assets $ 428,650 $ 369,526 $ 301,900 Liabilities and Equity Accounts payable Long-term notes payable secured by mortgages on plant assets Common stock, $10 par value Retained earnings $ 108,869 $ 63,699 $ 40,648 82,198 162,500 75,083 86,691 162,500 56,636 68,054 162,500 30,698 Total liabilities and equity $ 428,650 $ 369,526 $ 301,900 ecember 31, The company's income statements credit: the years ende 2016, follow. A all sales ar oi For Year Ended December 31 2017 2016 Sales $ 557,245 $ 439,736 Cost of goods sold Other operating expenses Interest expense $ 339,919 172,746 9,473 7,244 $ 285,828 111,253 10,114 6,596 Income taxes Total costs and expenses 529,382 413,791 Net income $ 27,863 $ 25,945 Earnings per share $ 1.71 1.60

Cornerstones of Financial Accounting
4th Edition
ISBN:9781337690881
Author:Jay Rich, Jeff Jones
Publisher:Jay Rich, Jeff Jones
Chapter6: Cost Of Goods Sold And Inventory
Section: Chapter Questions
Problem 16MCQ: ( Appendix 6B) Refer to the information for Morgan Inc. above. If Morgan uses a periodic inventory...

Related questions

Topic Video
Question
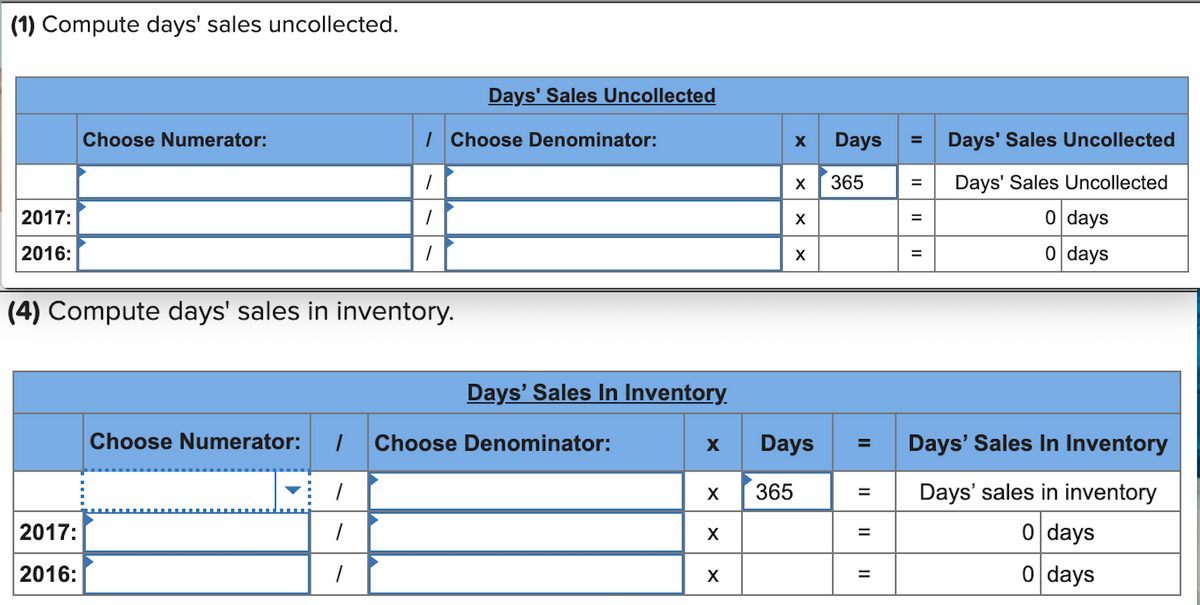
Transcribed Image Text:(1) Compute days' sales uncollected.
Days' Sales Uncollected
Choose Numerator:
| Choose Denominator:
Days
Days' Sales Uncollected
365
Days' Sales Uncollected
X
2017:
0 days
2016:
0 days
(4) Compute days' sales in inventory.
Days' Sales In Inventory.
Choose Numerator:
Choose Denominator:
Days
Days' Sales In Inventory
%3D
365
Days' sales in inventory
2017:
0 days
2016:
0 days
%D
II
II
II
II
II
![Exercise 13-8 Liquidity analysis and interpretation LO P3
[The following information applies to the questions displayed below.]
Simon Company's year-end balance sheets follow.
At December 31
2017
2016
2015
Assets
$ 25,796 $
89,300
112,500
8,307
30,153 $
62,200
83,000
7,915
30,486
50,700
57,000
3,387
Cash
Accounts receivable, net
Merchandise inventory
Prepaid expenses
Plant assets, net
192,747
186,258
160,327
Total assets
$ 428,650 $ 369,526 $ 301,900
Liabilities and Equity
Accounts payable
Long-term notes payable secured by
mortgages on plant assets
Common stock, $10 par value
Retained earnings
$ 108,869 $
63,699 $ 40,648
82,198
162,500
86,691
162,500
56,636
68,054
162,500
30,698
75,083
Total liabilities and equity
$ 428,650 $ 369,526 $ 301,900
The company's income statements for the years ended December 31, 2017 and 2016, follow. Assume that all sales are on
credit:
For Year Ended December 31
2017
2016
Sales
$ 557,245
$ 439,736
$ 339,919
172,746
9,473
7,244
$ 285,828
111,253
10,114
6,596
Cost of goods sold
Other operating expenses
Interest expense
Income taxes
Total costs and expenses
529,382
413,791
Net income
$ 27,863
$
25,945
Earnings per share
$
1.71
$
1.60](/v2/_next/image?url=https%3A%2F%2Fcontent.bartleby.com%2Fqna-images%2Fquestion%2F75227c3d-0045-449f-908c-0dff54e4e54b%2F7aaf674f-8751-468a-af81-c8d0f6b2d954%2F0k09kkh_processed.png&w=3840&q=75)
Transcribed Image Text:Exercise 13-8 Liquidity analysis and interpretation LO P3
[The following information applies to the questions displayed below.]
Simon Company's year-end balance sheets follow.
At December 31
2017
2016
2015
Assets
$ 25,796 $
89,300
112,500
8,307
30,153 $
62,200
83,000
7,915
30,486
50,700
57,000
3,387
Cash
Accounts receivable, net
Merchandise inventory
Prepaid expenses
Plant assets, net
192,747
186,258
160,327
Total assets
$ 428,650 $ 369,526 $ 301,900
Liabilities and Equity
Accounts payable
Long-term notes payable secured by
mortgages on plant assets
Common stock, $10 par value
Retained earnings
$ 108,869 $
63,699 $ 40,648
82,198
162,500
86,691
162,500
56,636
68,054
162,500
30,698
75,083
Total liabilities and equity
$ 428,650 $ 369,526 $ 301,900
The company's income statements for the years ended December 31, 2017 and 2016, follow. Assume that all sales are on
credit:
For Year Ended December 31
2017
2016
Sales
$ 557,245
$ 439,736
$ 339,919
172,746
9,473
7,244
$ 285,828
111,253
10,114
6,596
Cost of goods sold
Other operating expenses
Interest expense
Income taxes
Total costs and expenses
529,382
413,791
Net income
$ 27,863
$
25,945
Earnings per share
$
1.71
$
1.60
Expert Solution
This question has been solved!
Explore an expertly crafted, step-by-step solution for a thorough understanding of key concepts.

This is a popular solution!

Trending now
This is a popular solution!

Step by step
Solved in 3 steps

Knowledge Booster


Learn more about
Need a deep-dive on the concept behind this application? Look no further. Learn more about this topic, accounting and related others by exploring similar questions and additional content below.Recommended textbooks for you
Cornerstones of Financial Accounting
Accounting
ISBN:
9781337690881
Author:
Jay Rich, Jeff Jones
Publisher:
Cengage Learning

Corporate Financial Accounting
Accounting
ISBN:
9781305653535
Author:
Carl Warren, James M. Reeve, Jonathan Duchac
Publisher:
Cengage Learning

Financial Accounting
Accounting
ISBN:
9781305088436
Author:
Carl Warren, Jim Reeve, Jonathan Duchac
Publisher:
Cengage Learning
Cornerstones of Financial Accounting
Accounting
ISBN:
9781337690881
Author:
Jay Rich, Jeff Jones
Publisher:
Cengage Learning
Corporate Financial Accounting
Accounting
ISBN:
9781305653535
Author:
Carl Warren, James M. Reeve, Jonathan Duchac
Publisher:
Cengage Learning
Financial Accounting
Accounting
ISBN:
9781305088436
Author:
Carl Warren, Jim Reeve, Jonathan Duchac
Publisher:
Cengage Learning

Intermediate Accounting: Reporting And Analysis
Accounting
ISBN:
9781337788281
Author:
James M. Wahlen, Jefferson P. Jones, Donald Pagach
Publisher:
Cengage Learning

Principles of Accounting Volume 1
Accounting
ISBN:
9781947172685
Author:
OpenStax
Publisher:
OpenStax College

Corporate Financial Accounting
Accounting
ISBN:
9781337398169
Author:
Carl Warren, Jeff Jones
Publisher:
Cengage Learning