Sixty-five randomly selected car salespersons were asked the number of cars they generally sell in one week. Fifteen people answered that they generally sell three cars; eighteen generally sell four cars; fourteen generally sell five cars; eight generally sell six cars; ten generally sell seven cars. a. Complete the table. Enter the exact answers (i.e. enter your answers for the relative and cumulative relative frequencies as fractions, not as decimals). Data Value Frequency Relative Frequency Cumulative Relative Frequency (# cars) 3 Number Number Number 4 Number Number Number Number Number Number Number Number Number 7 Number Number Number Table 2.42 b. What does the frequency column in Table 2.42 sum to? Number c. What does the relative frequency column in Table 2.42 sum to? Number d. What is the difference between relative frequency and frequency for each data value in Table 2.42? The frequency for each data value is the Click for List frequency for each data value is the Click for List The relative e. What is the difference between cumulative relative frequency and relative frequency for each data value? The relative frequency for each data value is the Click for List The cumulative relative frequency for each data value is the Click for List
Sixty-five randomly selected car salespersons were asked the number of cars they generally sell in one week. Fifteen people answered that they generally sell three cars; eighteen generally sell four cars; fourteen generally sell five cars; eight generally sell six cars; ten generally sell seven cars. a. Complete the table. Enter the exact answers (i.e. enter your answers for the relative and cumulative relative frequencies as fractions, not as decimals). Data Value Frequency Relative Frequency Cumulative Relative Frequency (# cars) 3 Number Number Number 4 Number Number Number Number Number Number Number Number Number 7 Number Number Number Table 2.42 b. What does the frequency column in Table 2.42 sum to? Number c. What does the relative frequency column in Table 2.42 sum to? Number d. What is the difference between relative frequency and frequency for each data value in Table 2.42? The frequency for each data value is the Click for List frequency for each data value is the Click for List The relative e. What is the difference between cumulative relative frequency and relative frequency for each data value? The relative frequency for each data value is the Click for List The cumulative relative frequency for each data value is the Click for List

Glencoe Algebra 1, Student Edition, 9780079039897, 0079039898, 2018
18th Edition
ISBN:9780079039897
Author:Carter
Publisher:Carter
Chapter10: Statistics
Section10.6: Summarizing Categorical Data
Problem 10CYU

Related questions
Question
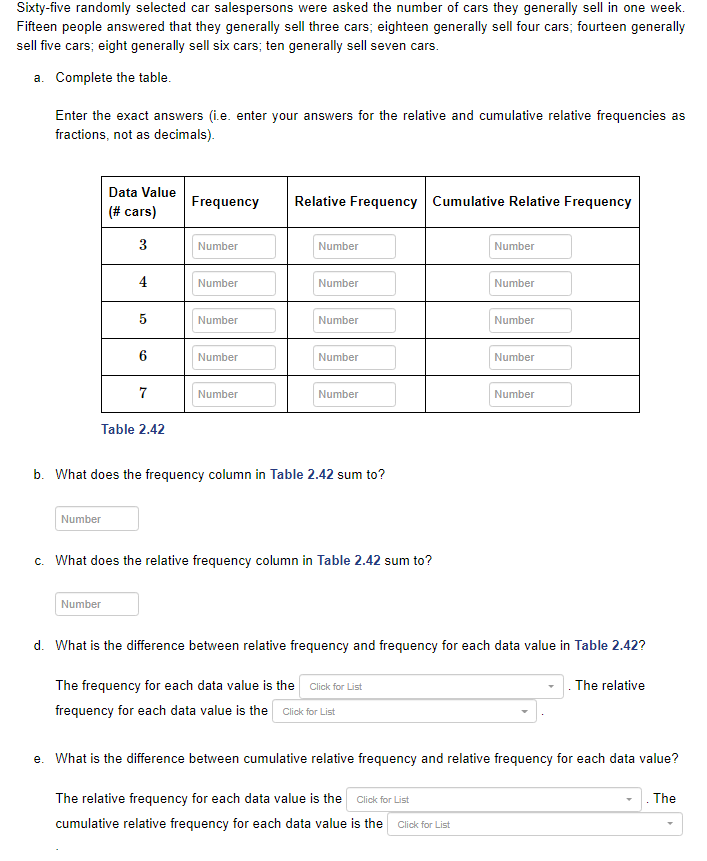
Transcribed Image Text:Sixty-five randomly selected car salespersons were asked the number of cars they generally sell in one week.
Fifteen people answered that they generally sell three cars; eighteen generally sell four cars; fourteen generally
sell five cars; eight generally sell six cars; ten generally sell seven cars.
a. Complete the table.
Enter the exact answers (i.e. enter your answers for the relative and cumulative relative frequencies as
fractions, not as decimals).
Data Value
Frequency
Relative Frequency Cumulative Relative Frequency
(# cars)
3
Number
Number
Number
4
Number
Number
Number
Number
Number
Number
Number
Number
Number
7
Number
Number
Number
Table 2.42
b. What does the frequency column in Table 2.42 sum to?
Number
c. What does the relative frequency column in Table 2.42 sum to?
Number
d. What is the difference between relative frequency and frequency for each data value in Table 2.42?
The frequency for each data value is the Click for List
frequency for each data value is the Click for List
The relative
e. What is the difference between cumulative relative frequency and relative frequency for each data value?
The relative frequency for each data value is the Click for List
The
cumulative relative frequency for each data value is the Click for List
Expert Solution
Step 1

Trending now
This is a popular solution!

Step by step
Solved in 2 steps with 2 images

Recommended textbooks for you
Glencoe Algebra 1, Student Edition, 9780079039897…
Algebra
ISBN:
9780079039897
Author:
Carter
Publisher:
McGraw Hill

Holt Mcdougal Larson Pre-algebra: Student Edition…
Algebra
ISBN:
9780547587776
Author:
HOLT MCDOUGAL
Publisher:
HOLT MCDOUGAL
Glencoe Algebra 1, Student Edition, 9780079039897…
Algebra
ISBN:
9780079039897
Author:
Carter
Publisher:
McGraw Hill
Holt Mcdougal Larson Pre-algebra: Student Edition…
Algebra
ISBN:
9780547587776
Author:
HOLT MCDOUGAL
Publisher:
HOLT MCDOUGAL