Sketch the graph of a continuous function y = h(x) such that a. h(0) = 0, -2 < h(x) < 2 for all x, h'(x)→∞ as x → 0¯, and h'(x) →∞ as x →0*; b. h(0) = 0, –-2 < h(x) < 0 for all x, h'(x) →∞ as x→0", and h'(x) →-∞ as x →0*.
Sketch the graph of a continuous function y = h(x) such that a. h(0) = 0, -2 < h(x) < 2 for all x, h'(x)→∞ as x → 0¯, and h'(x) →∞ as x →0*; b. h(0) = 0, –-2 < h(x) < 0 for all x, h'(x) →∞ as x→0", and h'(x) →-∞ as x →0*.

Chapter3: Functions
Section3.3: Rates Of Change And Behavior Of Graphs
Problem 2SE: If a functionfis increasing on (a,b) and decreasing on (b,c) , then what can be said about the local...

Related questions
Question
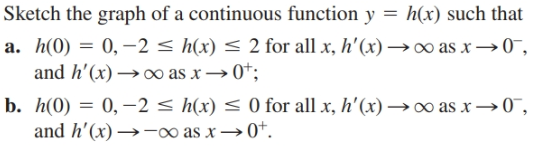
Transcribed Image Text:Sketch the graph of a continuous function y = h(x) such that
a. h(0) = 0, -2 < h(x) < 2 for all x, h'(x)→∞ as x → 0¯,
and h'(x) →∞ as x →0*;
b. h(0) = 0, –-2 < h(x) < 0 for all x, h'(x) →∞ as x→0",
and h'(x) →-∞ as x →0*.
Expert Solution
This question has been solved!
Explore an expertly crafted, step-by-step solution for a thorough understanding of key concepts.

This is a popular solution!

Trending now
This is a popular solution!

Step by step
Solved in 6 steps with 6 images

Recommended textbooks for you