

Q: A model for a power cable suspended between two towers is y = 18 + 25 cosh (x/25), −25 ≤ x ≤ 25 .…
A:
Q: A line intersects the point (4, 12) and has a slope of -5. What is the slope- intercept equation for…
A:
Q: Drag point B so the given line has a slope of -1/4.
A: If point B is at (7, -2) then slope of line that passes through A (3, -1) and B (7, -2) is…
Q: Use a geoboard to model slope Question What is the slope of the line on the geoboard shown? Provide…
A: according to definition of the slope in geoboard.
Q: Neaven Kuta Software - Infinite Algebral Name Period Finding Slope From a Graph Date Find the slope…
A: If x1, y1 and x2, y2 are two points then slope=y2-y1x2-x11 x1, y1=0,0 and x2, y2=2, 1…
Q: Plug in t
A: Given: Two points (-6,8) (12,4) To find: 1) Slope 2). Point slope form for (-6,8) 3).Point slope…
Q: moer maricopa.edu/assess2/7cid3D14014&aid 10419994/full Wirite the equation of the Line graphed…
A: Solve for the slope, vertical intercept and equation of line
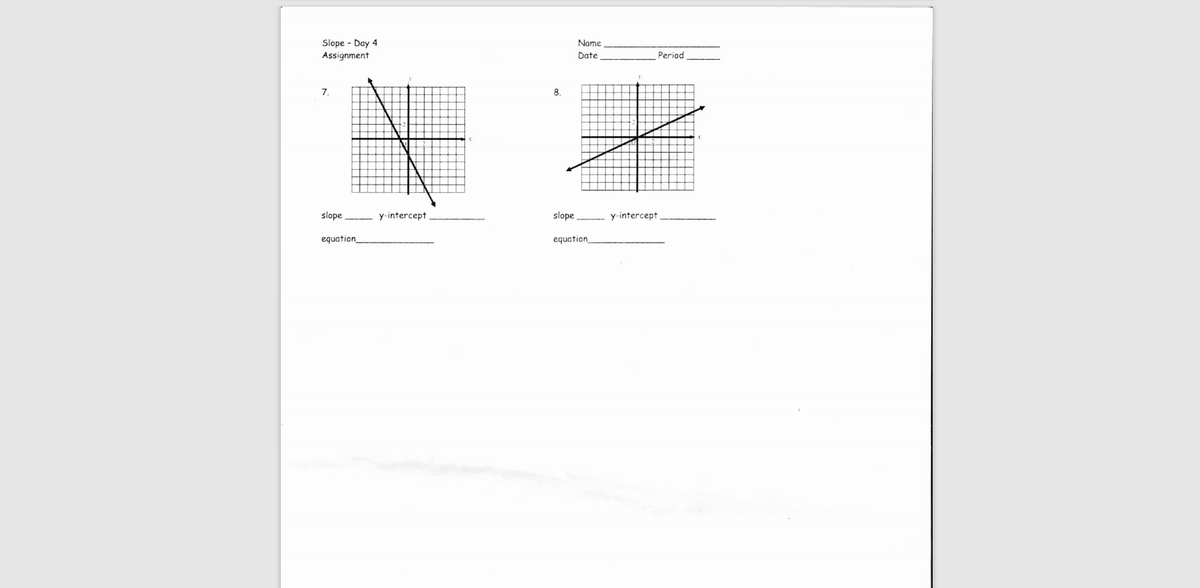
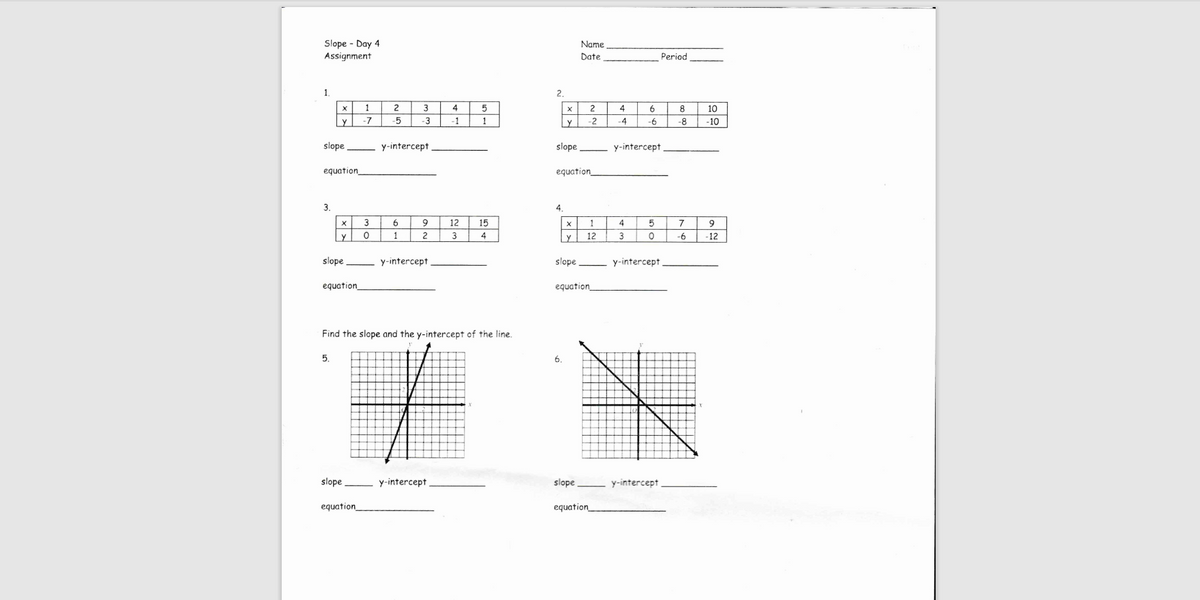
Q: find the slope and y-intercept of each line. Graph the line by hand. Verify your graph using a…
A: Given, x+y=1 now find the slope 1+dydx=0dydx=-1 so slope of this line is -1 line intercept on y-axis…
Q: find the slope and y-intercept of each line. Graph the line by hand. Verify your graph using a…
A: Explanation: Given that, y-x=0 Concept used: To find the x-intercept, put y = 0 into the equation…
Q: Activity 3: Using Slope and One Point Graph each linear equation given slope m and a point, then…
A: Given: 1. (3,1) and m=-3
Q: Vertex Concave up or down Axis of symmetry Y-intercept Zero(s) Slope Quadrants Domain
A:
Q: Percentage of young adults using social networkingsites. In 2006, the percentage of 18- to…
A: Given: Let, year is represented by x coordinate and percentage is represented by y coordinate then,…
Q: find the slope and y-intercept of each line. Graph the line by hand. Verify your graph using a…
A: Given equation of line is: y=-1
Q: : Grade of Road West of Albuquerque, New Mexico, Route 40 eastbound is straight and makes a steep…
A: Given that grade is the change in vertical distance with respect to change in horizontal distance.…
Q: Find the slope of the curve at the indicated point. Find the equations of the tangent and normal…
A: Please find attachment for the details solution
Q: intercept 4 and slope 1. Do these lines cross? If so, do they cross to the right or left of the…
A: General form of equation of line is y=mx+c, where m is the slope and c is the vertical intercept of…
Q: I need help pls
A:
Q: Equation #2 X=\ Slope undefined Complete a table of values for the ec y
A:
Q: ) find slope of the secant line (b)
A: 1.1 x3 - 35 x2 + 269 x + 560 So Now Slope of the secant line from x1 = 0 to x2 = 4 is given by…
Q: A swimming pool is circular with a diameter of 40 feet. Depth is constant along east-west lines and…
A:
Q: Grass buffer strips are grassy areas that are planted between bodies of water and agricultural…
A: Hi! Thank you for the question As per the honour code, We’ll answer the first question since the…
Q: slope = 1/2, passing through the origin (a)write equation for line in point-slope form (b) write…
A: Topic = Geometry
Q: estion 10 A given slope is m = -. Find its parallel slope and it's perpendicular slope. parallel…
A: The given slope is m= (-2/3) If two lines are parallel the slope should be same for both lines. If…
Q: Equation 1 U-3x =5 4-3x=5 y-intercept 0,5) Slope 3 Complete a table of values for the equation Y
A:
Q: www-awu.aleks.com/aleksc LINES AND FUNCTIONS Graphing a line glven its slope and y-intercept Graph…
A: The objective is to graph the line with slope -2 and y intercept -4.
Q: ons/Interface/acellus_engine.html?ClassID%3629155217 My Classes aming X 9 My Drive-Google D... A…
A:
Q: Use a graphing utility to graph equation .Then use the TRACE feature to trace along the line and…
A: To Determine: Use a graphing utility to graph equation .Then use the TRACE feature to trace along…
Q: Point-Slope Form Date Period e 2015 Kuta Software LLC. All rights reserved. Write the…
A: As per our guidelines I am solving only first three questions please resubmit other questions To…
Q: A model for a power cable suspended between two towers is y = 10 + 15 cosh (x/15), −15 ≤ x ≤ 15 .…
A: Given: Graph of the function
Q: Graduation rates, part III Continuing with the regres-sion of Exercise 1, write a sentence that…
A: The given output shows the regression model and associated plots for the graduate rates and…
Q: Stopping Distance: The graph shows the stopping distance (y axis)in metres, and the speed of a car…
A: It is an important part of statistics. It is widely used.
Q: Grass buffer strips are grassy areas that are planted between bodies of water and agricultural…
A: Distribution of the Sample Mean: If the distribution of the population has mean μ and standard…
Q: 3 and y-intercept =1. Graph the line with slope
A:
Q: 2 When graphing equations it is important to have the equation in form. Choice Options Slope…
A: Topic:- geometry
Q: Sketch a graph of the equation identify the slope and y-intercept Y=x+4
A: The given equation is y=x+4. To find: slope and y-intercept of the equation y=x+4. To draw: graph of…
Q: с. (0, -4) (3,-8) С.
A: We’ll answer the first question since the exact one wasn’t specified. Please submit a new question…
Q: Ôhttps://www-awu.aleks.com/alekscgi/x/l! O SLOPE AND LINES Graphing a line given its equation in…
A: It is an important part of statistics. It is widely used.
Q: View History Bookmarks People Window Help Take a Test -Jaelyn Dancy ter a…
A: we will find two form of line by using these formulas and given condition
Q: Find the equation of line b described below, in slope-intercept form. Line a is perpendicular to…
A: ⚛Slope intercept form:- y =mx + c where m => slope C => y-…
Q: MIDDIN Equation #6 4-7 Slope Zevo Complete a table of values for the equation Y
A:
Q: Determine the slope intercept equation of the line from the graph
A:
Q: a. Find a slope-intercept equation for line A. b. Find a point-slope equation for line B.
A:
Q: Find the point-slope form of the line passing through the given points. Use the first point as…
A: Given: 2,3 and 5,-3
Q: find a linear equation in slope intercept form that best models the following graph Y=_x+_ Round…
A: The given graph shown is as follows: According to the graph, the data points are : 1, 6.8, 5, 3.6,…
Q: Content attribution QUESTION 11 1 POINT 5a - 2. 2 Identify the slope and y-intercept of the line y…
A: Consider the given integral.
Q: assessment Midterm Assessment Question number 4 First convert the equation -x+y = -5 into…
A:
Q: Line with a slope of 11/5 and passing through (0, 12) Write the standard form of an equation for…
A: We have the details as given belowSlope, m = 115point through which it passes = (0,12)let us define…
Q: GRUUP B noitoupe Equation #4 4=0 Slope Zero Complete a table of values for the equation.…
A: Solution of this question is

Son needs help in Algebra class. Please assist with the attached files.


Trending now
This is a popular solution!

Step by step
Solved in 3 steps with 1 images


- the table shows the attendence at a minor-league baseball game for the first 8 games the season game 1 2 3 4 5 6 7 8 attendence 8,673 8,903 9,103 9,091 9,117 9,134 9,256 9,573 a. use the data table and technology to generate a line of of best fit. round the slope and y-intercept to the nearest whole number. what do the slope and y-intercept of the line represent in the problem situation? b. identify the correlation, coefficient, or r-value, of the line. what does this value tell you c. predict the attendence for the game 12. explain your reasoningThe correlation between two variables is given by r = 0.0 indicates: a. All of the points must fall exactly on a horizontal straight line.b. All of the points must fall exactly on a vertical straight line.c. perfect positive relationship between the two variablesd. perfect negative relationship between the two variables. e. The best straight line through the data is horizontal.The correlation between two variables is given by r = 0.0 indicates:Select one:a. All of the points must fall exactly on a horizontal straight line.b. All of the points must fall exactly on a vertical straight line.c. perfect positive relationship between the two variablesd. perfect negative relationship between the two variables. e. The best straight line through the data is horizontal.
- Using the regression line attached. The best (i.e., the “most correct”) interpretation of the slope in the plot is: a) for a one-unit increase in height, weight will definitely increase by 3.899 units b) for a one-unit increase in height, weight, on average, increases by 3.899 units c) for a one-unit decrease in height, weight, on average, increases by 3.899 units d) for a one-unit decrease in height, weight, on average, increases by 3.899 units e) for a one-unit increase in height, weight, on average, decreases by 3.899 unitsa. In a left-tailed test, α=.05, the critical value of z is:-1.645-1.962.33-2.58 b. The ____________ is the same as the point-slope form equation of a line, that is used for prediction.trendlineregression linefrequency polygonnone of thesec. If two variables are significantly correlated, we can predict the value of the dependent variable if we know the value of the independent variable. The process is called _______correlation analysishypothesis testingregression analysisestimationd. Involves two variables that are taken from a sample or population.univariate databivariate datahypothesisestimatee. For the decision rule: Reject the null hypothesis if the computed statistic _______ positive critical value or if the computed value statistic is ______ negative critical value.≥ ; ≤> ; <= ; <> ; =f. An intelligent guess about the characteristic of a population is calledmeanproportionhypothesistest statisticThe table below shows the amounts of crude oil (in thousands of barrels per day) produced by a country and the amounts of crude oil (in thousands of barrels per day) imported by a country, for the last seven years. Construct and interpret a 95% prediction interval for the amount of crude oil imported by the this country when the amount of crude oil produced by the country is 5,509 thousand barrels per day. The equation of the regression line is ModifyingAbove .y=−1.137x+15,912.199. Oil produced, x 5,830 5,704 5,645 5,405 5,159 5,053 5,028 Oil imported, y 9,300 9,117 9,628 10,062 10,119 10,159 10,013 Construct and interpret a 95% prediction interval for the amount of crude oil imported when the amount of crude oil produced by the country is 5,509 thousand barrels per day. Select the correct choice below and fill in the answer boxes to complete your choice. (Round to the nearest cent as needed.) A. We can be 95% confident…
- Suppose you use regression topredict the height of a womanscurrent boyfriend by using her ownheight as the explanatory variable.Height was measured in feet from asample of 100 womenundergraduates, and their boyfriends,at Dalhousie University. Now, supposethat the height of both the womenand the men are converted tocentimeters. The impact of thisconversion on the slope is:define and state the difference between the three terms association, correlation and causation. find the regression line between the height of the strawberry plant and the water it gets per day and interpret the intercept and slope coefficients. find a 95% confidence interval around the plant estimate of the slope parameter from your model.The least-squares regression equation is y=784.6x+12,431 where y is the median income and x is the percentage of 25 years and older with at least a bachelor's degree in the region. The scatter diagram indicates a linear relation between the two variables with a correlation coefficient of 0.7962. Interpret the slope.
- Decide if gender of the students has a significant influence on the relationship between exam 2 and final results. Assume that the intercepts of the models for males and females are the same. Do not test for equality of intercepts. Are the slopes of the relationships between final and exam2 scores difference for males and females? Test on 10% significance. Include complex and simple model, hypotheses, test statistic, pvalue, and final regression equations for men and womena) Find the equation of the regression line. Provide slope and y-intercept, explicitly. Ifyou can’t find slope, use slope = −500.b) Create a 95% confidence interval for the slope of the regression line and explain whatyour interval means in the context of this problem. Provide Lower Confidence Limit andUpper Confidence Limit explicitly.Find the slope of regression line, y-intercept of regression line, coefficient of determination (r^2), and the linear correlation coefficient (r)