Solve the following by concept of normal distribution and graph clearly. Show your complete solution and write clearly and readable. Thank you. In a job fair, 3000 applicants applied for a job. Their mean age was found to be 28 with a standard deviation of 4 years. A.) how many have ages between 24 and 32? (Area or probability for the z table can be converted into percentage. Use this percentage to get exact answer.)
Solve the following by concept of normal distribution and graph clearly. Show your complete solution and write clearly and readable. Thank you. In a job fair, 3000 applicants applied for a job. Their mean age was found to be 28 with a standard deviation of 4 years. A.) how many have ages between 24 and 32? (Area or probability for the z table can be converted into percentage. Use this percentage to get exact answer.)

A First Course in Probability (10th Edition)
10th Edition
ISBN:9780134753119
Author:Sheldon Ross
Publisher:Sheldon Ross
Chapter1: Combinatorial Analysis
Section: Chapter Questions
Problem 1.1P: a. How many different 7-place license plates are possible if the first 2 places are for letters and...

Related questions
Question
Solve the following by concept of normal distribution and graph clearly. Show your complete solution and write clearly and readable. Thank you.
In a job fair, 3000 applicants applied for a job. Their mean age was found to be 28 with a standard deviation of 4 years.
A.) how many have ages between 24 and 32? (Area or probability for the z table can be converted into percentage. Use this percentage to get exact answer.)
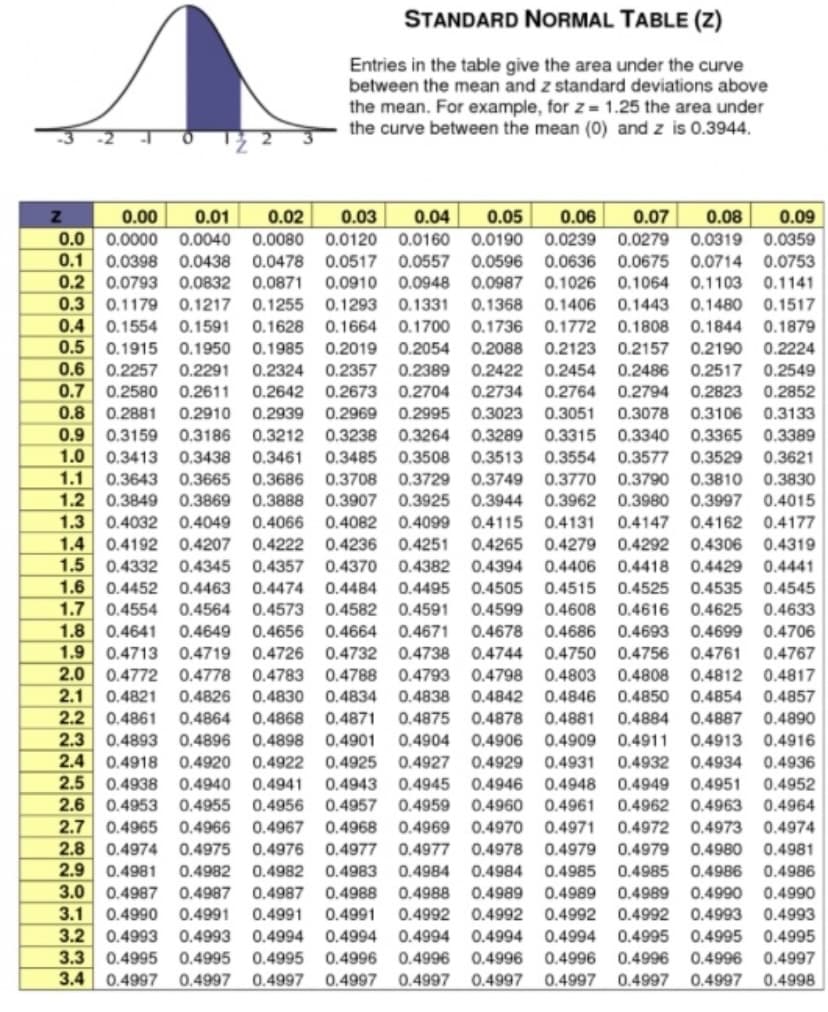
Transcribed Image Text:STANDARD NORMAL TABLE (Z)
Entries in the table give the area under the curve
between the mean and z standard deviations above
the mean. For example, for z = 1.25 the area under
the curve between the mean (0) and z is 0.3944.
0.00
0.01
0.02
0.03
0.04
0.05
0.06
0.07
0.08
0.09
0.0 0.0000
0.0040
0.0080
0.0120
0.0160
0.0190
0.0239 0.0279
0.0319 0.0359
0.0398
0.2 0.0793
0.3 0.1179
0.4 0.1554
0.1
0.0478 0.0517 0.0557
0.0871
0.1255
0.0438
0.0596
0.0636 0.0675
0.0714 0.0753
0.1103
0.1480
0.0832
0.0910
0.0948
0.0987
0.1026
0.1064
0.1141
0.1217
0.1293
0.1331
0.1368
0.1406 0.1443
0.1517
0.1700
0.2054
0.1879
0.2224
0.1591
0.1628
0.1664
0.1736
0.1772
0.1808
0.1844
0.5
0.1915
0.1950 0.1985
0.2019
0.2088
0.2123
0.2157
0.2190
0.6
0.2257
0.2291 0.2324 0.2357
0.2389
0.2422
0.2454
0.2486
0.2517
0.2549
0.7 0.2580
0.2611
0.2642
0.2673
0.2704
0.2734
0.2764
0.2794
0.2823
0.2852
0.8
0.2881
0.2910
0.2939
0.2969
0.2995
0.3023
0.3051
0.3078
0.3106
0.3133
0.9
1.0
0.3212 0.3238 0.3264
0.3461
0.3686
0.3186
0.3289
0.3340
0.3365 0.3389
0.3529
0.3159
0.3315
0.3413
0.3438
0.3485
0.3508
0.3513
0.3554
0.3577
0.3621
1.1
1.2
1.3
0.3643
0.3665
0.3708
0.3729
0.3749
0.3770
0.3790
0.3810
0.3830
0.3849
0.3869
0.3907
0.4082 0.4099
0.3888
0.3925
0.3944
0.3962
0.3980
0.3997
0.4015
0.4032
0.4049
0.4066
0.4115
0.4131
0.4147
0.4162
0.4177
1.4
0.4192
0.4207
0.4222
0.4236
0.4251
0.4265
0.4279
0.4292
0.4306
0.4319
1.5
0.4332
0.4345
0.4357
0.4370
0.4382
0.4394
0.4406
0.4418
0.4429
0.4441
1.6
1.7
1.8
0.4452
0.4463
0.4474
0.4484
0.4495
0.4505
0.4515
0.4525
0.4535
0.4545
0.4554
0.4641
0.4564
0.4573
0.4582
0.4591
0.4599
0.4608
0.4616
0.4625
0.4633
0.4649
0.4656
0.4664
0.4671
0.4678
0.4686
0.4693
0.4699
0.4706
1.9
2.0 0.4772
2.1
2.2 0.4861
0.4719
0.4778
0.4713
0.4726
0.4732
0.4738
0.4744
0.4750
0.4756 0.4761
0.4767
0.4783
0.4788
0.4793 0.4798
0.4842
0.4803
0.4808
0.4812
0.4817
0.4838
0.4875
0.4821
0.4826
0.4830
0.4834
0.4846
0.4850
0.4854
0.4857
0.4864
0.4868
0.4871
0.4878
0.4881
0.4884
0.4887 0.4890
2.3
2.4
2.5
0.4893
0.4918
0.4896
0.4898
0.4901
0.4904
0.4906
0.4909
0.4911
0.4913
0.4916
0.4920
0.4922
0.4925
0.4927
0.4929
0.4931
0.4932 0.4934
0.4936
0.4938
0.4953
0.4965
0.4941
0.4956
0.4940
0.4945
0.4959
0.4943
0.4946
0.4948
0.4949
0.4951
0.4952
2.6
0.4955
0.4966
0.4975
0.4957
0.4960
0.4961
0.4962
0.4963
0.4964
2.7
0.4967
0.4968
0.4969
0.4970
0.4971
0.4972 0.4973
0.4974
2.8
2.9
3.0
3.1
3.2
3.3 0.4995
3.4 0.4997
0.4974
0.4976
0.4977
0.4977
0.4978
0.4979
0.4979
0.4980
0.4981
0.4981
0.4982
0.4982
0.4983
0.4984
0.4984
0.4985
0.4985
0.4986
0.4986
0.4987
0.4987
0.4987
0.4988
0.4988
0.4989
0.4989
0.4989
0.4990
0.4990
0.4991
0.4991
0.4992
0.4994 0.4994
0.4990
0.4991
0.4992
0.4992
0.4992
0.4993
0.4993
0.4993
0.4995
0.4993
0.4994
0.4994
0.4994
0.4995
0.4995
0.4995
0.4995
0.4996
0.4996
0.4996
0.4996
0.4996
0.4996
0.4997
0.4997
0.4997 0.4997
0.4997
0.4997
0.4997
0.4997
0.4997
0.4998
Expert Solution
This question has been solved!
Explore an expertly crafted, step-by-step solution for a thorough understanding of key concepts.

Step by step
Solved in 2 steps with 4 images

Recommended textbooks for you
A First Course in Probability (10th Edition)
Probability
ISBN:
9780134753119
Author:
Sheldon Ross
Publisher:
PEARSON

A First Course in Probability (10th Edition)
Probability
ISBN:
9780134753119
Author:
Sheldon Ross
Publisher:
PEARSON