ST The data are believed to be representative of the behavior of the population at large. Formulate the Markov chain for housing movements.(Hint: Notice that the survey looks backward in time.)
ST The data are believed to be representative of the behavior of the population at large. Formulate the Markov chain for housing movements.(Hint: Notice that the survey looks backward in time.)

Functions and Change: A Modeling Approach to College Algebra (MindTap Course List)
6th Edition
ISBN:9781337111348
Author:Bruce Crauder, Benny Evans, Alan Noell
Publisher:Bruce Crauder, Benny Evans, Alan Noell
Chapter5: A Survey Of Other Common Functions
Section5.3: Modeling Data With Power Functions
Problem 6E: Urban Travel Times Population of cities and driving times are related, as shown in the accompanying...

Related questions
Question
Transcribed Image Text:1
bindwee
(10 700 2
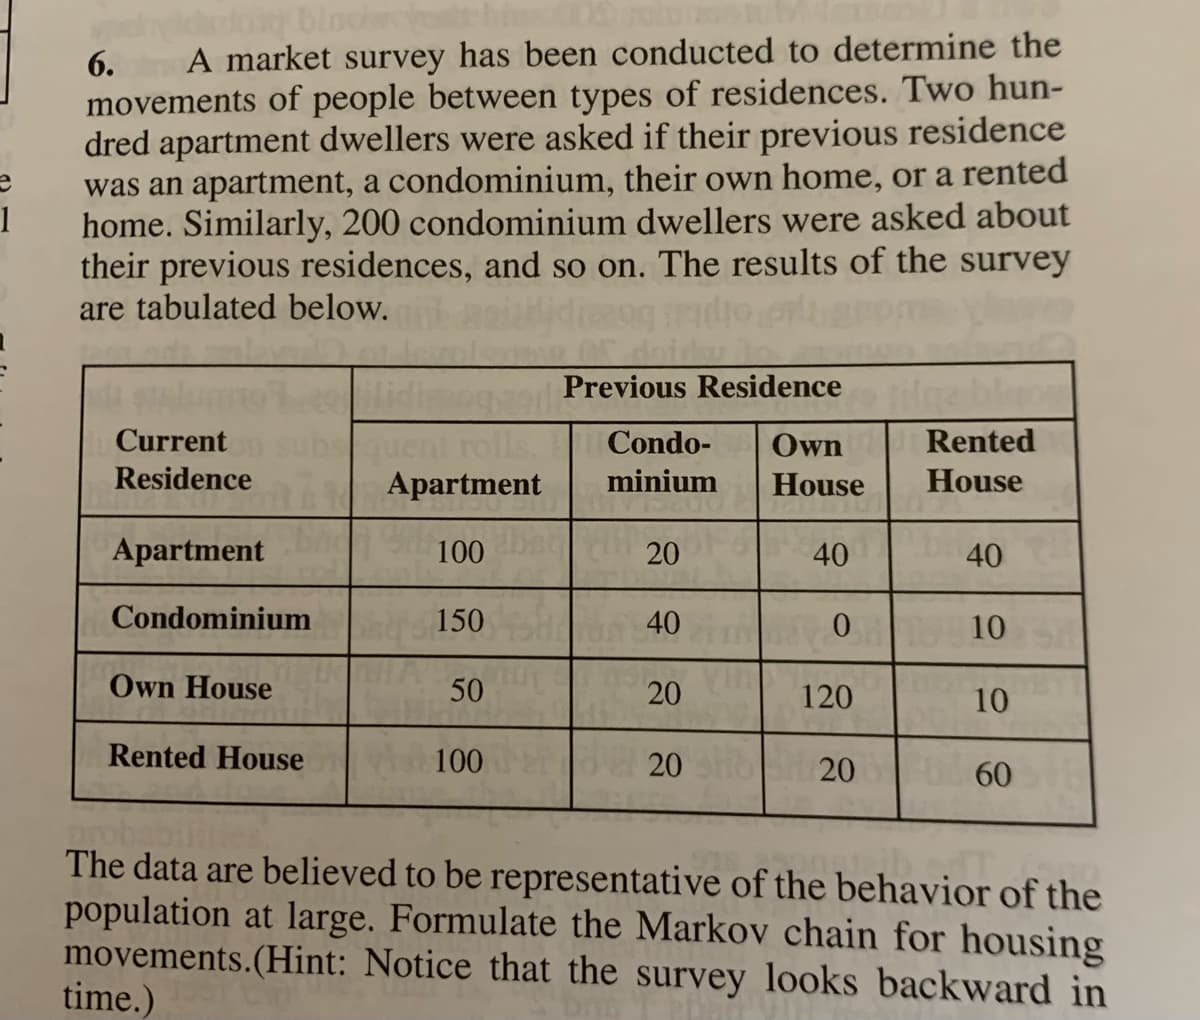
A market survey has been conducted to determine the
movements of people between types of residences. Two hun-
dred apartment dwellers were asked if their previous residence
was an apartment, a condominium, their own home, or a rented
home. Similarly, 200 condominium dwellers were asked about
their previous residences, and so on. The results of the survey
are tabulated below.
6.
Current
Residence
Apartment
Condominium
Own House
Rented House
uent rolls.
Apartment
100
time.)
150
50
100
Previous Residence Hilge
Condo-
Own
minium
House
20
40
20
20
40
10
120
20
Rented
House
40
10
10
60
The data are believed to be representative of the behavior of the
population at large. Formulate the Markov chain for housing
movements.(Hint: Notice that the survey looks backward in
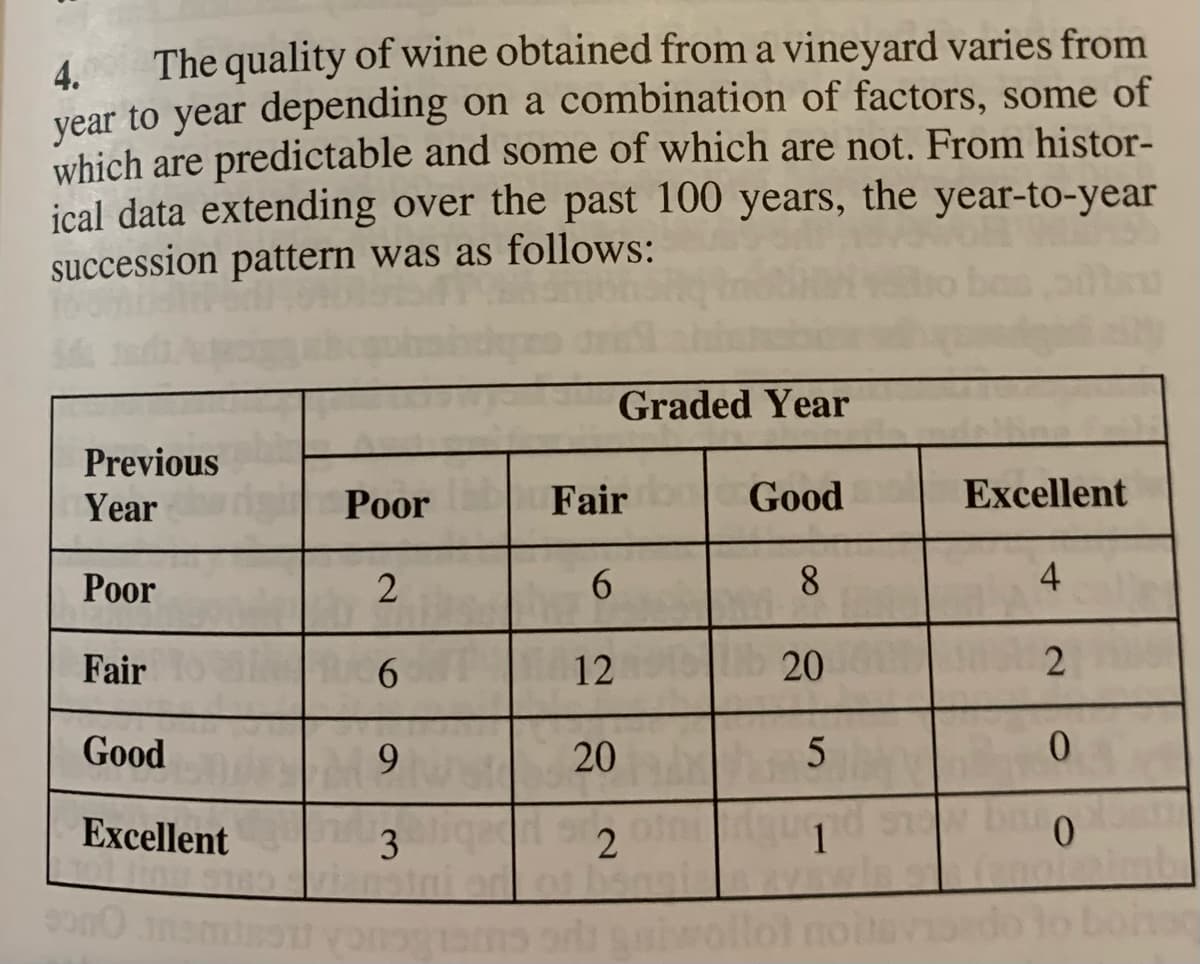
Transcribed Image Text:4. The quality of wine obtained from a vineyard varies from
year to year depending on a combination of factors, some of
which are predictable and some of which are not. From histor-
ical data extending over the past 100 years, the year-to-year
succession pattern was as follows:
Previous
Year
Poor
Fair
Good
Excellent
si
sono
Poor
2
6
9
3
vous
130
Fair
6
12
Graded Year
20
2
Good
8
20
Excellent
2
0
baro
0
aiwollol noitavi do to bohac
5
1
4
Expert Solution
This question has been solved!
Explore an expertly crafted, step-by-step solution for a thorough understanding of key concepts.

This is a popular solution!

Trending now
This is a popular solution!

Step by step
Solved in 3 steps

Recommended textbooks for you
Functions and Change: A Modeling Approach to Coll…
Algebra
ISBN:
9781337111348
Author:
Bruce Crauder, Benny Evans, Alan Noell
Publisher:
Cengage Learning
Functions and Change: A Modeling Approach to Coll…
Algebra
ISBN:
9781337111348
Author:
Bruce Crauder, Benny Evans, Alan Noell
Publisher:
Cengage Learning