state. 0.94 0.71 0.96 0.72 0.74 0.55 0.84 0.64 0.62 0.47 G 0.58 0.44 (A) Draw a scatter plot of the data and a graph of the model on the same axes. Choose the correct graph below. O A. В. OC. OD. Q 14 0.5 0.- 0.5- 0,5 04 0- 0.7 1.4 State pop. (millions, x) 0.7 State pop. (millions, x) 1.4 0.7 State pop. (millions, x) 0.7 1.4 1.4 State pop. (millions, x) Drivers (millions, y) Drivers (millions, y) Drivers (millions, 1 Drivers (millions, y)
state. 0.94 0.71 0.96 0.72 0.74 0.55 0.84 0.64 0.62 0.47 G 0.58 0.44 (A) Draw a scatter plot of the data and a graph of the model on the same axes. Choose the correct graph below. O A. В. OC. OD. Q 14 0.5 0.- 0.5- 0,5 04 0- 0.7 1.4 State pop. (millions, x) 0.7 State pop. (millions, x) 1.4 0.7 State pop. (millions, x) 0.7 1.4 1.4 State pop. (millions, x) Drivers (millions, y) Drivers (millions, y) Drivers (millions, 1 Drivers (millions, y)

Algebra & Trigonometry with Analytic Geometry
13th Edition
ISBN:9781133382119
Author:Swokowski
Publisher:Swokowski
Chapter7: Analytic Trigonometry
Section7.6: The Inverse Trigonometric Functions
Problem 93E

Related questions
Question
7
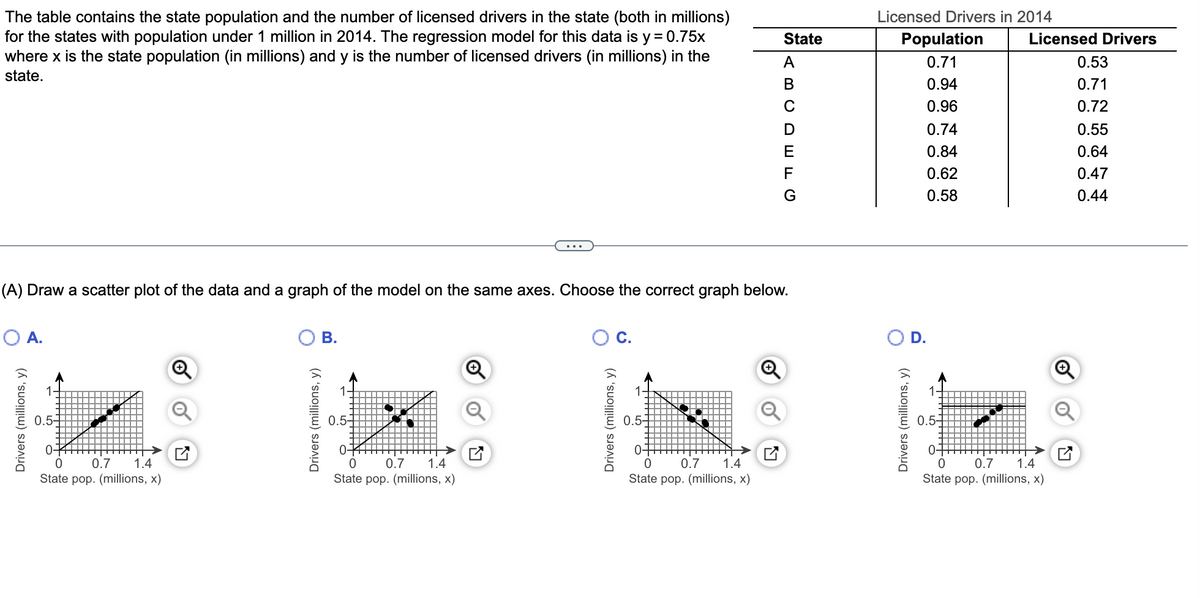
Transcribed Image Text:The table contains the state population and the number of licensed drivers in the state (both in millions)
for the states with population under 1 million in 2014. The regression model for this data is y = 0.75x
where x is the state population (in millions) and y is the number of licensed drivers (in millions) in the
Licensed Drivers in 2014
State
Population
Licensed Drivers
A
0.71
0.53
state.
В
0.94
0.71
0.96
0.72
0.74
0.55
0.84
0.64
F
0.62
0.47
0.58
0.44
(A) Draw a scatter plot of the data and a graph of the model on the same axes. Choose the correct graph below.
O A.
В.
D.
0.5-
0.5-
0.5-
0.5
0-
0-
1.4
0.7
State pop. (millions, x)
0.7
0.7
1.4
1.4
0.7
1.4
State pop. (millions, x)
State pop. (millions, x)
State pop. (millions, x)
Drivers (millions, y)
Drivers (millions, y)
Drivers (millions, y)
Drivers (millions, y)
Expert Solution
This question has been solved!
Explore an expertly crafted, step-by-step solution for a thorough understanding of key concepts.

Step by step
Solved in 2 steps with 1 images

Recommended textbooks for you
Algebra & Trigonometry with Analytic Geometry
Algebra
ISBN:
9781133382119
Author:
Swokowski
Publisher:
Cengage

Functions and Change: A Modeling Approach to Coll…
Algebra
ISBN:
9781337111348
Author:
Bruce Crauder, Benny Evans, Alan Noell
Publisher:
Cengage Learning
Algebra & Trigonometry with Analytic Geometry
Algebra
ISBN:
9781133382119
Author:
Swokowski
Publisher:
Cengage
Functions and Change: A Modeling Approach to Coll…
Algebra
ISBN:
9781337111348
Author:
Bruce Crauder, Benny Evans, Alan Noell
Publisher:
Cengage Learning