(Statistical Anaylsis) For the following graph, explain the reason for every statistic that is calculated. For example, You have a scatter plot of an hourly wages vs level of education, the trend is represented by a cubic curve with R^2=0.999. It can mean that the relationship of the level of education vs the hourly wages has a cubic trend as the cubic model suits well the set of data (R^2 is very close to 1).
(Statistical Anaylsis) For the following graph, explain the reason for every statistic that is calculated. For example, You have a scatter plot of an hourly wages vs level of education, the trend is represented by a cubic curve with R^2=0.999. It can mean that the relationship of the level of education vs the hourly wages has a cubic trend as the cubic model suits well the set of data (R^2 is very close to 1).

College Algebra
7th Edition
ISBN:9781305115545
Author:James Stewart, Lothar Redlin, Saleem Watson
Publisher:James Stewart, Lothar Redlin, Saleem Watson
Chapter9: Counting And Probability
Section: Chapter Questions
Problem 7T: An anagram of a word is a rearrangement of the letters of the word. (a) How many anagrams of the...

Related questions
Question
(Statistical Anaylsis)
For the following graph, explain the reason for every statistic that is calculated.
For example, You have a
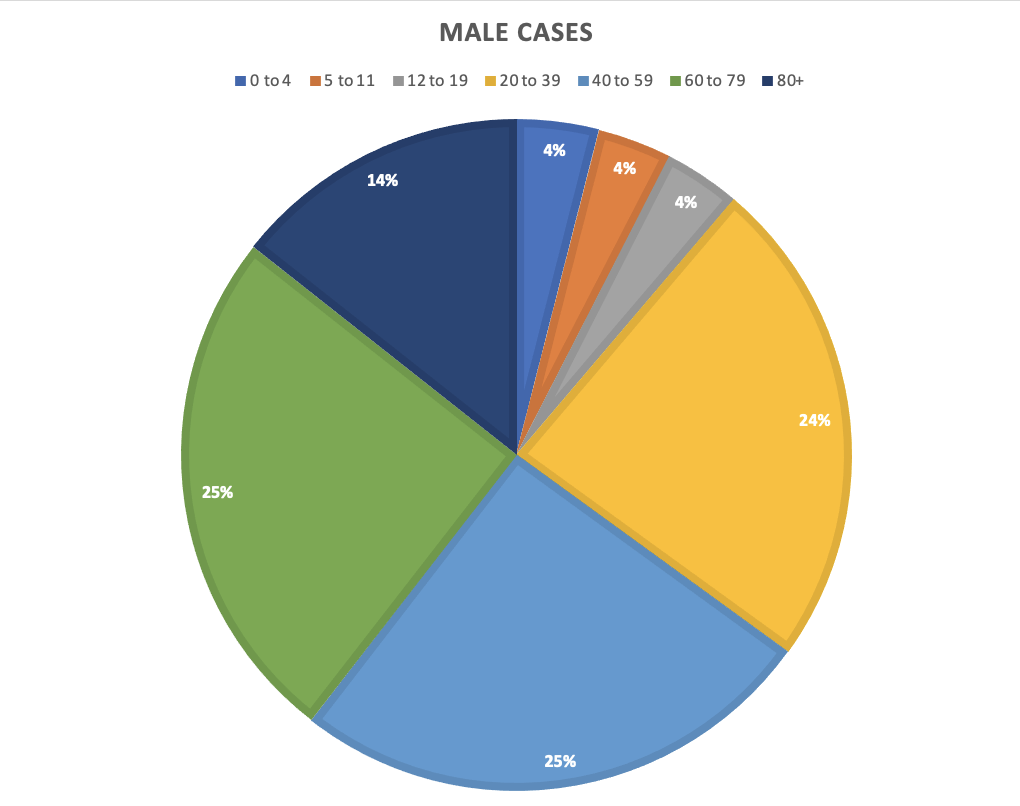
Transcribed Image Text:25%
MALE CASES
■0 to 4 ■5 to 1112 to 1920 to 39 40 to 59 60 to 79 80+
4%
4%
14%
25%
4%
24%
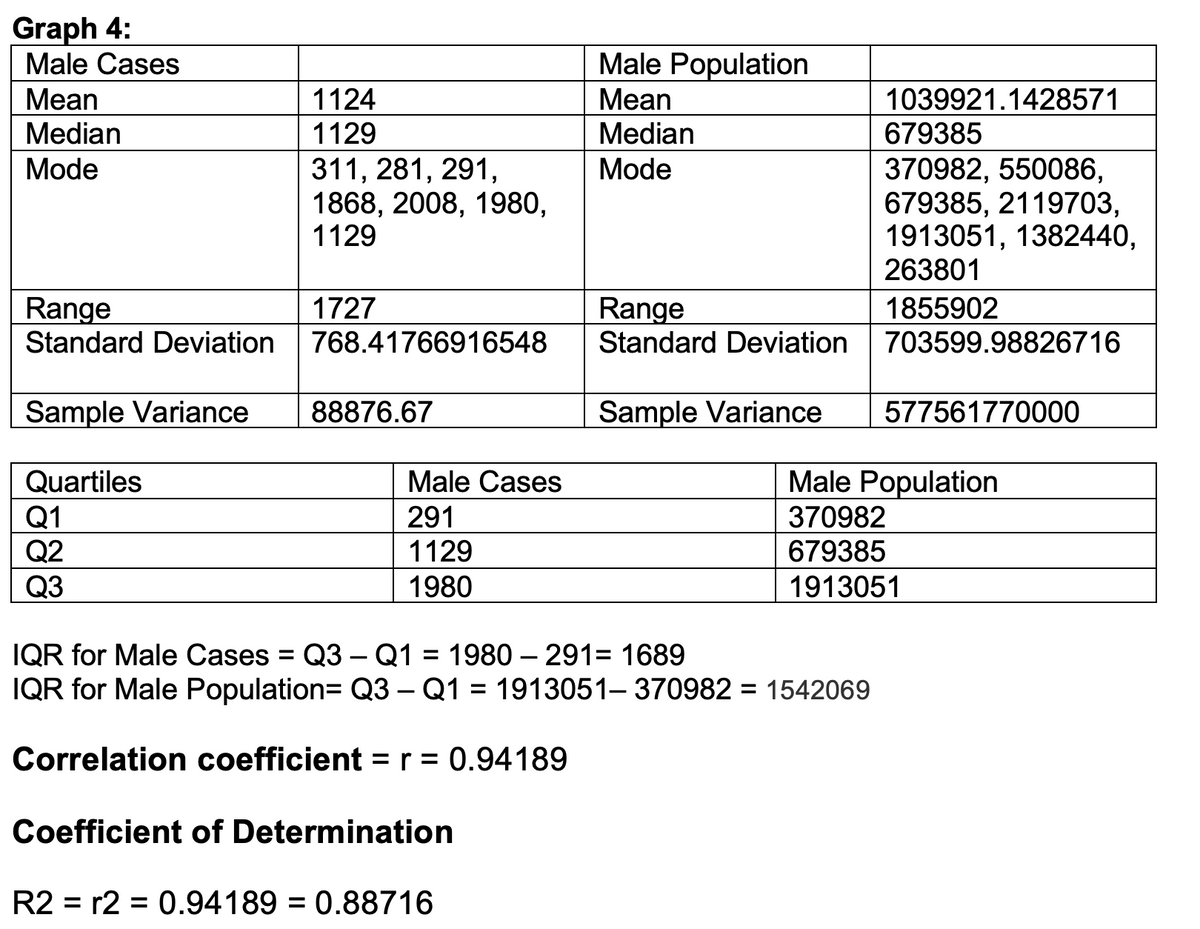
Transcribed Image Text:Graph 4:
Male Cases
1124
Mean
Median
1129
Mode
311, 281, 291,
1868, 2008, 1980,
1129
Range
1727
Standard Deviation
768.41766916548
Sample Variance 88876.67
Quartiles
Male Cases
Male Population
Q1
291
370982
Q2
1129
679385
Q3
1980
1913051
IQR for Male Cases = Q3 – Q1 = 1980 – 291= 1689
IQR for Male Population= Q3 - Q1 = 1913051-370982=1542069
Correlation coefficient = r = 0.94189
Coefficient of Determination
R2 = r2 = 0.94189 = 0.88716
Male Population
Mean
Median
Mode
Range
Standard Deviation
Sample Variance
1039921.1428571
679385
370982, 550086,
679385, 2119703,
1913051, 1382440,
263801
1855902
703599.98826716
577561770000
Expert Solution
This question has been solved!
Explore an expertly crafted, step-by-step solution for a thorough understanding of key concepts.

Step by step
Solved in 2 steps

Recommended textbooks for you
College Algebra
Algebra
ISBN:
9781305115545
Author:
James Stewart, Lothar Redlin, Saleem Watson
Publisher:
Cengage Learning

Glencoe Algebra 1, Student Edition, 9780079039897…
Algebra
ISBN:
9780079039897
Author:
Carter
Publisher:
McGraw Hill

Algebra: Structure And Method, Book 1
Algebra
ISBN:
9780395977224
Author:
Richard G. Brown, Mary P. Dolciani, Robert H. Sorgenfrey, William L. Cole
Publisher:
McDougal Littell
College Algebra
Algebra
ISBN:
9781305115545
Author:
James Stewart, Lothar Redlin, Saleem Watson
Publisher:
Cengage Learning
Glencoe Algebra 1, Student Edition, 9780079039897…
Algebra
ISBN:
9780079039897
Author:
Carter
Publisher:
McGraw Hill
Algebra: Structure And Method, Book 1
Algebra
ISBN:
9780395977224
Author:
Richard G. Brown, Mary P. Dolciani, Robert H. Sorgenfrey, William L. Cole
Publisher:
McDougal Littell

Algebra & Trigonometry with Analytic Geometry
Algebra
ISBN:
9781133382119
Author:
Swokowski
Publisher:
Cengage

Algebra and Trigonometry (MindTap Course List)
Algebra
ISBN:
9781305071742
Author:
James Stewart, Lothar Redlin, Saleem Watson
Publisher:
Cengage Learning