Stopping Distance The police department must determine the speed limit on a bridge such that the flow rate of cars is maximum per unit time. The greater the speed limit, the farther apart the cars must be in order to keep a safe stopping distance. Experimental data on the stopping distances d (in meters) for various speeds v (in kilometers per hour) are shown in the table. 20 40 60 80 100 d 5.1 13.7 27.2 44.2 66.4 (a) Convert the speeds v in the table to speeds s in meters per second. Use the regression capabilities of a graphing utility to find a model of the form d(s) = as² + bs + c for the data. (b) Consider two consecutive vehicles of average length 5.5 meters, traveling at a safe speed on the bridge. Let T be the difference between the times (in seconds) when the front bumpers of the vehicles pass a given point on the bridge. Verify that this difference in times is given by d(s) , 5.5 T + (c) Use a graphing utility to graph the function T and estimate the speed s that minimizes the time between vehicles.
Stopping Distance The police department must determine the speed limit on a bridge such that the flow rate of cars is maximum per unit time. The greater the speed limit, the farther apart the cars must be in order to keep a safe stopping distance. Experimental data on the stopping distances d (in meters) for various speeds v (in kilometers per hour) are shown in the table. 20 40 60 80 100 d 5.1 13.7 27.2 44.2 66.4 (a) Convert the speeds v in the table to speeds s in meters per second. Use the regression capabilities of a graphing utility to find a model of the form d(s) = as² + bs + c for the data. (b) Consider two consecutive vehicles of average length 5.5 meters, traveling at a safe speed on the bridge. Let T be the difference between the times (in seconds) when the front bumpers of the vehicles pass a given point on the bridge. Verify that this difference in times is given by d(s) , 5.5 T + (c) Use a graphing utility to graph the function T and estimate the speed s that minimizes the time between vehicles.

Algebra & Trigonometry with Analytic Geometry
13th Edition
ISBN:9781133382119
Author:Swokowski
Publisher:Swokowski
Chapter4: Polynomial And Rational Functions
Section4.6: Variation
Problem 31E

Related questions
Question
Find the speed limit in the bridge such that the flow rate of vehicles is maximum per unit time.
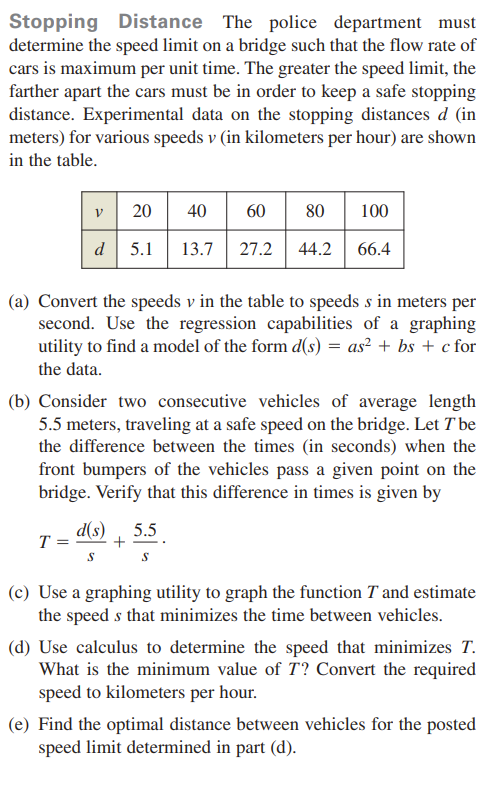
Transcribed Image Text:Stopping Distance The police department must
determine the speed limit on a bridge such that the flow rate of
cars is maximum per unit time. The greater the speed limit, the
farther apart the cars must be in order to keep a safe stopping
distance. Experimental data on the stopping distances d (in
meters) for various speeds v (in kilometers per hour) are shown
in the table.
v
20
40
60
80
100
d 5.1
13.7
27.2
44.2
66.4
(a) Convert the speeds v in the table to speeds s in meters per
second. Use the regression capabilities of a graphing
utility to find a model of the form d(s) = as² + bs + c for
the data.
(b) Consider two consecutive vehicles of average length
5.5 meters, traveling at a safe speed on the bridge. Let Tbe
the difference between the times (in seconds) when the
front bumpers of the vehicles pass a given point on the
bridge. Verify that this difference in times is given by
d(s)
5.5
T =
+
(c) Use a graphing utility to graph the function T and estimate
the speed s that minimizes the time between vehicles.
(d) Use calculus to determine the speed that minimizes T.
What is the minimum value of T? Convert the required
speed to kilometers per hour.
(e) Find the optimal distance between vehicles for the posted
speed limit determined in part (d).
Expert Solution
This question has been solved!
Explore an expertly crafted, step-by-step solution for a thorough understanding of key concepts.

Step by step
Solved in 4 steps with 4 images

Recommended textbooks for you
Algebra & Trigonometry with Analytic Geometry
Algebra
ISBN:
9781133382119
Author:
Swokowski
Publisher:
Cengage

Functions and Change: A Modeling Approach to Coll…
Algebra
ISBN:
9781337111348
Author:
Bruce Crauder, Benny Evans, Alan Noell
Publisher:
Cengage Learning

Algebra and Trigonometry (MindTap Course List)
Algebra
ISBN:
9781305071742
Author:
James Stewart, Lothar Redlin, Saleem Watson
Publisher:
Cengage Learning
Algebra & Trigonometry with Analytic Geometry
Algebra
ISBN:
9781133382119
Author:
Swokowski
Publisher:
Cengage
Functions and Change: A Modeling Approach to Coll…
Algebra
ISBN:
9781337111348
Author:
Bruce Crauder, Benny Evans, Alan Noell
Publisher:
Cengage Learning
Algebra and Trigonometry (MindTap Course List)
Algebra
ISBN:
9781305071742
Author:
James Stewart, Lothar Redlin, Saleem Watson
Publisher:
Cengage Learning

Trigonometry (MindTap Course List)
Trigonometry
ISBN:
9781337278461
Author:
Ron Larson
Publisher:
Cengage Learning

College Algebra
Algebra
ISBN:
9781305115545
Author:
James Stewart, Lothar Redlin, Saleem Watson
Publisher:
Cengage Learning