Studies on a machine that molds plastic water pipe indicate that when it is injecting 25.76 mm diameter pipe, the process standard deviation is 0.75 mm. The pipe has a specification of 25.76 mm plus or minus 1.95 mm. What is the process capability index (Cp)? Оа. 0.4333 O b. 2.6 Ос. 1.733
Studies on a machine that molds plastic water pipe indicate that when it is injecting 25.76 mm diameter pipe, the process standard deviation is 0.75 mm. The pipe has a specification of 25.76 mm plus or minus 1.95 mm. What is the process capability index (Cp)? Оа. 0.4333 O b. 2.6 Ос. 1.733

Practical Management Science
6th Edition
ISBN:9781337406659
Author:WINSTON, Wayne L.
Publisher:WINSTON, Wayne L.
Chapter2: Introduction To Spreadsheet Modeling
Section: Chapter Questions
Problem 20P: Julie James is opening a lemonade stand. She believes the fixed cost per week of running the stand...

Related questions
Question
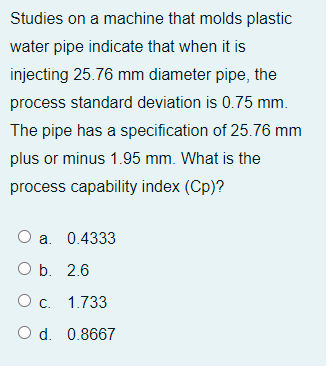
Transcribed Image Text:Studies on a machine that molds plastic
water pipe indicate that when it is
injecting 25.76 mm diameter pipe, the
process standard deviation is 0.75 mm.
The pipe has a specification of 25.76 mm
plus or minus 1.95 mm. What is the
process capability index (Cp)?
O
a. 0.4333
b. 2.6
О с. 1.733
O d. 0.8667
Expert Solution
This question has been solved!
Explore an expertly crafted, step-by-step solution for a thorough understanding of key concepts.

This is a popular solution!

Trending now
This is a popular solution!

Step by step
Solved in 2 steps with 2 images

Recommended textbooks for you
Practical Management Science
Operations Management
ISBN:
9781337406659
Author:
WINSTON, Wayne L.
Publisher:
Cengage,

Operations Management
Operations Management
ISBN:
9781259667473
Author:
William J Stevenson
Publisher:
McGraw-Hill Education

Operations and Supply Chain Management (Mcgraw-hi…
Operations Management
ISBN:
9781259666100
Author:
F. Robert Jacobs, Richard B Chase
Publisher:
McGraw-Hill Education
Practical Management Science
Operations Management
ISBN:
9781337406659
Author:
WINSTON, Wayne L.
Publisher:
Cengage,
Operations Management
Operations Management
ISBN:
9781259667473
Author:
William J Stevenson
Publisher:
McGraw-Hill Education
Operations and Supply Chain Management (Mcgraw-hi…
Operations Management
ISBN:
9781259666100
Author:
F. Robert Jacobs, Richard B Chase
Publisher:
McGraw-Hill Education


Purchasing and Supply Chain Management
Operations Management
ISBN:
9781285869681
Author:
Robert M. Monczka, Robert B. Handfield, Larry C. Giunipero, James L. Patterson
Publisher:
Cengage Learning

Production and Operations Analysis, Seventh Editi…
Operations Management
ISBN:
9781478623069
Author:
Steven Nahmias, Tava Lennon Olsen
Publisher:
Waveland Press, Inc.