study was conducted to see how people reacted to certain facial expressions. A sample group of n = 36 was randomly divided into six groups. Each group was assigned to view one picture of a person making a facial expression. Each group saw a different picture, and the different expressions were (1) Surprised (2) Nervous (3) Scared (4) Sad (5) Excited (6) Angry. After viewing the pictures, the subjects were asked to rank the degree of dominance they inferred from the facial expression they saw. (The scale ranged from-10 to 10) The data collected is summarized in the table below. Surprised Nervous Scared Sad Excited Angry -0.5 -1.9 0.2 1.4 -0.4 1.3 1.1 -2 -0.2-0.5-1.4-1.9 0 -1.9 -1.9 1.7 1.6 -1.9 0.9 1.9 -1.4 0.8 0.9 -1.8 -1.3 -1.3 0 0.4 -0.3 -1 0.5 -1.4 0.2 -0.4 0.2 -1 Complete the following ANOVA table df SS MS F Source Expressions Error Total
study was conducted to see how people reacted to certain facial expressions. A sample group of n = 36 was randomly divided into six groups. Each group was assigned to view one picture of a person making a facial expression. Each group saw a different picture, and the different expressions were (1) Surprised (2) Nervous (3) Scared (4) Sad (5) Excited (6) Angry. After viewing the pictures, the subjects were asked to rank the degree of dominance they inferred from the facial expression they saw. (The scale ranged from-10 to 10) The data collected is summarized in the table below. Surprised Nervous Scared Sad Excited Angry -0.5 -1.9 0.2 1.4 -0.4 1.3 1.1 -2 -0.2-0.5-1.4-1.9 0 -1.9 -1.9 1.7 1.6 -1.9 0.9 1.9 -1.4 0.8 0.9 -1.8 -1.3 -1.3 0 0.4 -0.3 -1 0.5 -1.4 0.2 -0.4 0.2 -1 Complete the following ANOVA table df SS MS F Source Expressions Error Total

Glencoe Algebra 1, Student Edition, 9780079039897, 0079039898, 2018
18th Edition
ISBN:9780079039897
Author:Carter
Publisher:Carter
Chapter10: Statistics
Section10.6: Summarizing Categorical Data
Problem 10CYU

Related questions
Question
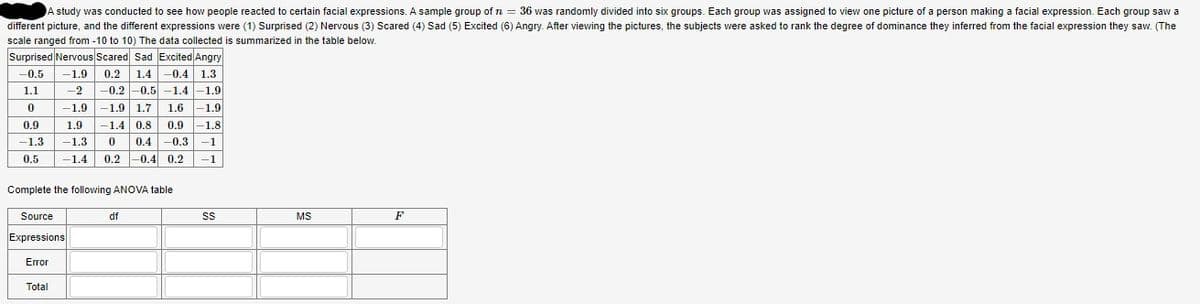
Transcribed Image Text:A study was conducted to see how people reacted to certain facial expressions. A sample group of n = 36 was randomly divided into six groups. Each group was assigned to view one picture of a person making a facial expression. Each group saw a
different picture, and the different expressions were (1) Surprised (2) Nervous (3) Scared (4) Sad (5) Excited (6) Angry. After viewing the pictures, the subjects were asked to rank the degree of dominance they inferred from the facial expression they saw. (The
scale ranged from -10 to 10) The data collected is summarized in the table below.
Surprised Nervous Scared Sad Excited Angry
-0.5 -1.9
0.2 1.4 -0.4 1.3
1.1
-2
-0.2 -0.5
-1.4 -1.9
0
-1.9
-1.9 1.7
1.6 -1.9
0.9
-1.4 0.8
0.9 -1.8
0 0.4 -0.3 -1
-1
SS
MS
F
1.9
-1.3
0.5
-1.4 0.2 0.4 0.2
Complete the following ANOVA table
Source
df
Expressions
Error
Total
-1.3
Expert Solution
This question has been solved!
Explore an expertly crafted, step-by-step solution for a thorough understanding of key concepts.

This is a popular solution!

Trending now
This is a popular solution!

Step by step
Solved in 3 steps with 1 images

Recommended textbooks for you
Glencoe Algebra 1, Student Edition, 9780079039897…
Algebra
ISBN:
9780079039897
Author:
Carter
Publisher:
McGraw Hill

Holt Mcdougal Larson Pre-algebra: Student Edition…
Algebra
ISBN:
9780547587776
Author:
HOLT MCDOUGAL
Publisher:
HOLT MCDOUGAL
Glencoe Algebra 1, Student Edition, 9780079039897…
Algebra
ISBN:
9780079039897
Author:
Carter
Publisher:
McGraw Hill
Holt Mcdougal Larson Pre-algebra: Student Edition…
Algebra
ISBN:
9780547587776
Author:
HOLT MCDOUGAL
Publisher:
HOLT MCDOUGAL