Suppose that a researcher, using data on class size (CS) and average test scores from 100 third-grade classes, estimates the OLS regression: TestScore = 520.4 – 5.82 × CS, R2 = 0.08, SER = 11.5. a. A classroom has 22 students. What is the regression's prediction for that classroom's average test score? b. Last year a classroom had 19 students, and this year it has 23 students. What is the regression's prediction for the change in the classroom average test score? c. The sample average class size across the 100 classrooms is 21.4. What is the sample average of the test scores across the 100 classrooms? (Hint: Review the formulas for the OLS estimators.)
Suppose that a researcher, using data on class size (CS) and average test scores from 100 third-grade classes, estimates the OLS regression: TestScore = 520.4 – 5.82 × CS, R2 = 0.08, SER = 11.5. a. A classroom has 22 students. What is the regression's prediction for that classroom's average test score? b. Last year a classroom had 19 students, and this year it has 23 students. What is the regression's prediction for the change in the classroom average test score? c. The sample average class size across the 100 classrooms is 21.4. What is the sample average of the test scores across the 100 classrooms? (Hint: Review the formulas for the OLS estimators.)

College Algebra
7th Edition
ISBN:9781305115545
Author:James Stewart, Lothar Redlin, Saleem Watson
Publisher:James Stewart, Lothar Redlin, Saleem Watson
Chapter1: Equations And Graphs
Section: Chapter Questions
Problem 10T: Olympic Pole Vault The graph in Figure 7 indicates that in recent years the winning Olympic men’s...

Related questions
Question
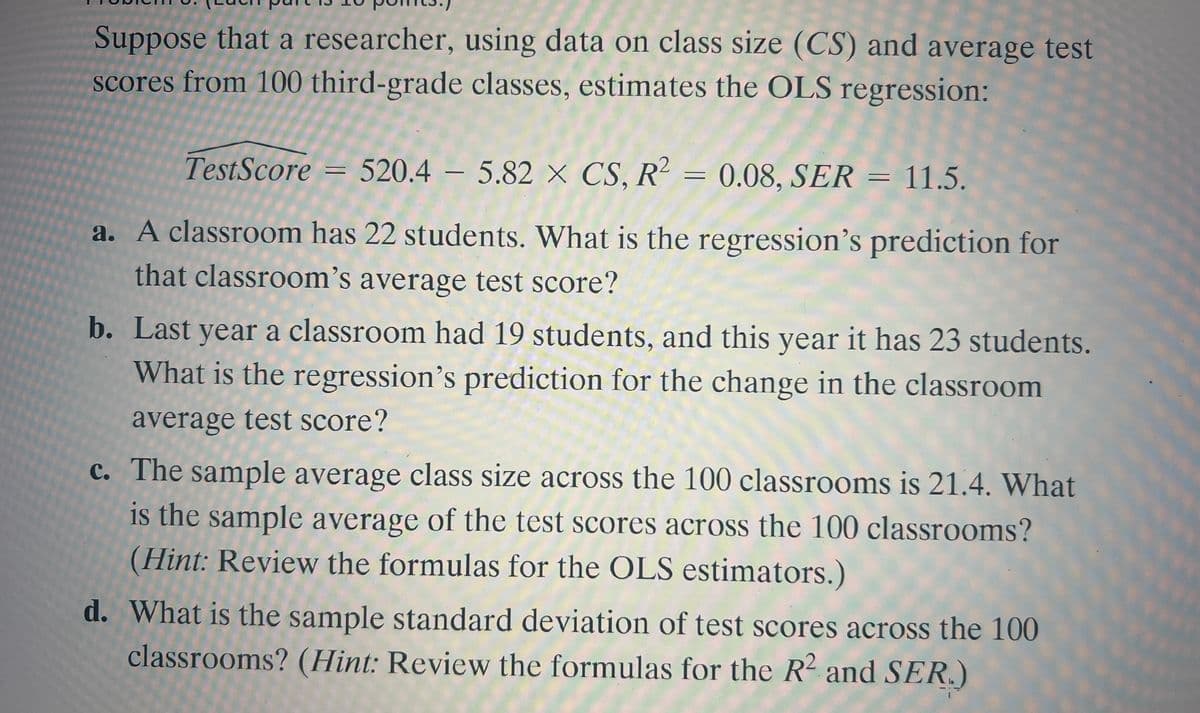
Transcribed Image Text:Suppose that a researcher, using data on class size (CS) and average test
scores from 100 third-grade classes, estimates the OLS regression:
TestScore = 520.4 – 5.82 × CS, R = 0.08, SER = 11.5.
a. A classroom has 22 students. What is the regression's prediction for
that classroom's average test score?
b. Last year a classroom had 19 students, and this year it has 23 students.
What is the regression's prediction for the change in the classroom
average test score?
c. The sample average class size across the 100 classrooms is 21.4. What
is the sample average of the test scores across the 100 classrooms?
(Hint: Review the formulas for the OLS estimators.)
d. What is the sample standard deviation of test scores across the 100
classrooms? (Hint: Review the formulas for the R2 and SER.)
Expert Solution
This question has been solved!
Explore an expertly crafted, step-by-step solution for a thorough understanding of key concepts.

This is a popular solution!

Trending now
This is a popular solution!

Step by step
Solved in 2 steps with 1 images

Recommended textbooks for you
College Algebra
Algebra
ISBN:
9781305115545
Author:
James Stewart, Lothar Redlin, Saleem Watson
Publisher:
Cengage Learning


Linear Algebra: A Modern Introduction
Algebra
ISBN:
9781285463247
Author:
David Poole
Publisher:
Cengage Learning
College Algebra
Algebra
ISBN:
9781305115545
Author:
James Stewart, Lothar Redlin, Saleem Watson
Publisher:
Cengage Learning
Linear Algebra: A Modern Introduction
Algebra
ISBN:
9781285463247
Author:
David Poole
Publisher:
Cengage Learning

Algebra and Trigonometry (MindTap Course List)
Algebra
ISBN:
9781305071742
Author:
James Stewart, Lothar Redlin, Saleem Watson
Publisher:
Cengage Learning

Glencoe Algebra 1, Student Edition, 9780079039897…
Algebra
ISBN:
9780079039897
Author:
Carter
Publisher:
McGraw Hill

Functions and Change: A Modeling Approach to Coll…
Algebra
ISBN:
9781337111348
Author:
Bruce Crauder, Benny Evans, Alan Noell
Publisher:
Cengage Learning