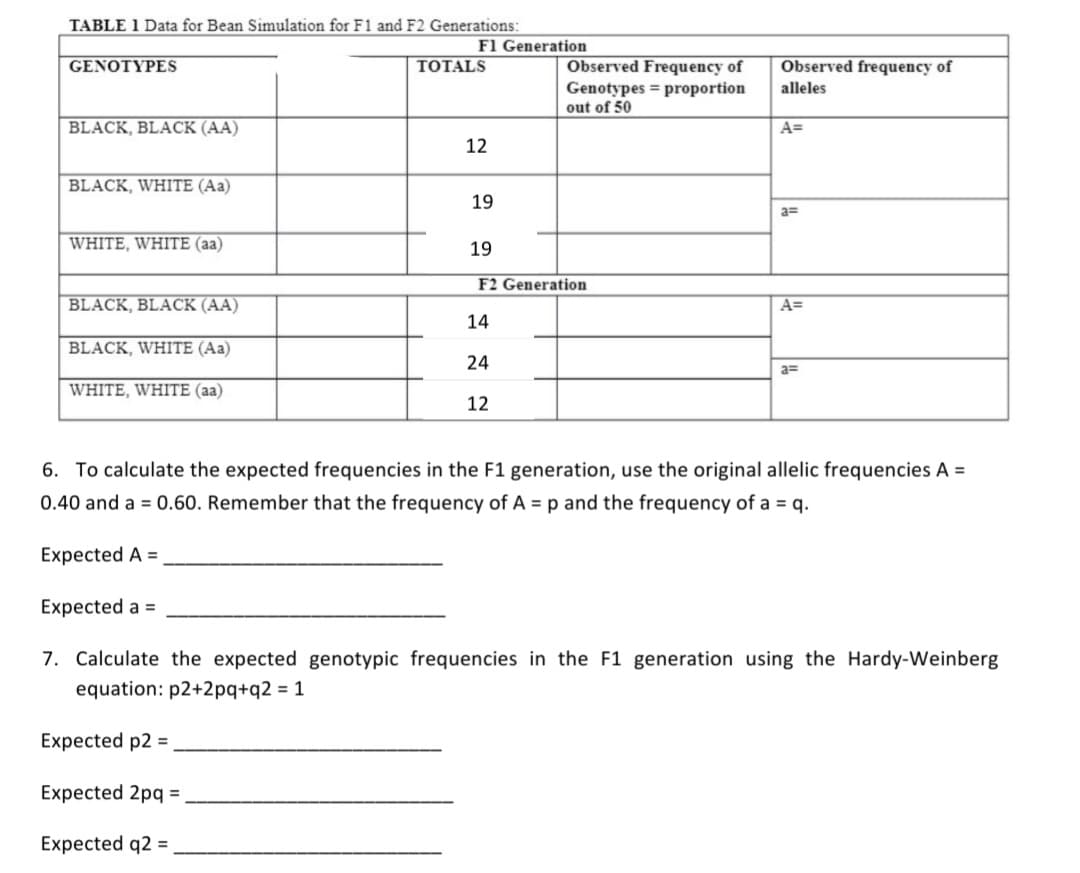
TABLE 1 Data for Bean Simulation for F1 and F2 Generations: F1 Generation Observed Frequency of Observed frequency of alleles GENOTYPES TOTALS Genotypes = proportion out of 50 BLACK, BLACK (AA) A= 12 BLACK, WHITE (Aa) 19 a= WHITE, WHITE (aa) 19 F2 Generation BLACK, BLACK (AA) A= 14 BLACK, WHITE (Aa) 24 WHITE, WHITE (aa) 12 6. To calculate expected frequencies in the F1 generation, use the original allelic frequencies A = 0.40 and a = 0.60. Remember that the frequency of A = p and the frequency of a = q. Expected A = Expected a = 7. Calculate the expected genotypic frequencies in the F1 generation using the Hardy-Weinberg equation: p2+2pq+q2 = 1

Biology: The Dynamic Science (MindTap Course List)
4th Edition
ISBN:9781305389892
Author:Peter J. Russell, Paul E. Hertz, Beverly McMillan
Publisher:Peter J. Russell, Paul E. Hertz, Beverly McMillan
Chapter12: Mendel, Genes, And Inheritance
Section: Chapter Questions
Problem 3ITD: Half of the worlds population eats rice at least twice a day. Much of this rice is grown in flooded...
icon
Related questions
Question
100%
60 black beans and 40 white beans into the baggie. Let the black beans represent the dominant allele A, and the white beans represent the recessive allele a, in the gene pool
TABLE 1 Data for Bean Simulation for F1 and F2 Generations:
F1 Generation
GENOTYPES
TOTALS
Observed Frequency of
Observed frequency of
Genotypes = proportion
out of 50
alleles
BLACK, BLACK (AA)
A=
12
BLACK, WHITE (Aa)
19
a=
WHITE, WHITE (aa)
19
F2 Generation
BLACK, BLACK (AA)
A=
14
BLACK, WHITE (Aa)
24
a=
WHITE, WHITE (aa)
12
6. To calculate the expected frequencies in the F1 generation, use the original allelic frequencies A =
0.40 and a = 0.60. Remember that the frequency of A = p and the frequency of a = q.
Expected A =
Expected a =
7. Calculate the expected genotypic frequencies in the F1 generation using the Hardy-Weinberg
equation: p2+2pq+q2 = 1
Expected p2 =
Expected 2pq =
Expected q2 =
Transcribed Image Text:TABLE 1 Data for Bean Simulation for F1 and F2 Generations: F1 Generation GENOTYPES TOTALS Observed Frequency of Observed frequency of Genotypes = proportion out of 50 alleles BLACK, BLACK (AA) A= 12 BLACK, WHITE (Aa) 19 a= WHITE, WHITE (aa) 19 F2 Generation BLACK, BLACK (AA) A= 14 BLACK, WHITE (Aa) 24 a= WHITE, WHITE (aa) 12 6. To calculate the expected frequencies in the F1 generation, use the original allelic frequencies A = 0.40 and a = 0.60. Remember that the frequency of A = p and the frequency of a = q. Expected A = Expected a = 7. Calculate the expected genotypic frequencies in the F1 generation using the Hardy-Weinberg equation: p2+2pq+q2 = 1 Expected p2 = Expected 2pq = Expected q2 =
Expert Solution
steps

Step by step

Solved in 7 steps

Blurred answer
Knowledge Booster
Genetic variation
Learn more about
Need a deep-dive on the concept behind this application? Look no further. Learn more about this topic, biology and related others by exploring similar questions and additional content below.
Similar questions
  • SEE MORE QUESTIONS
Recommended textbooks for you
Biology: The Dynamic Science (MindTap Course List)
Biology
ISBN:
9781305389892
Author:
Peter J. Russell, Paul E. Hertz, Beverly McMillan
Publisher:
Cengage Learning