Table 1: Data for Mean-Variance Portfolio Optimization Stock A Stock B Stock C 2% 8% 2% 12% Return Volatility Correlation A B C 10% 18% A 1 B -0.2 1 C 0.7 0.1 1


Q: Consider a deposit into a savings account of £300 that accumulates to £322.78 in exactly one and a…
A: Simple interest is the simplest form of calculating the interest on the principal amount for the…
Q: Duration and price sensitivity a) Calculate the duration and modified duration of a bond with a face…
A: Here,Face Value of Bond $ 1,000.00Time to Maturity in years10Coupon6%YTM5%
Q: A firm has no debt outstanding and a total market value of $938,080. Earnings before interest and…
A: EPS stands for earnings per share. It is essentially the net profits of a company divided by the…
Q: Given below is information about three RM $5000 par value bonds, each of which pays coupon…
A: Price of the bond is the PV of all future coupons and par value discounted at the required return.…
Q: Rebecca is interested in purchasing a European call on a hot new stock, Up, Inc. The call has a…
A: European options refer to the options that can only be exercised at the expiry date. The put-call…
Q: Consider the following two projects: Project Year 0 Year 1 Year 2 Cash Flow Cash Flow Cash Flow A B…
A: YearsCash Flows0($73)1$302$303$304$30Required:Profitability Index of project B=?
Q: Required information [The following information applies to the questions displayed below.] Mason…
A: Income taxes at the federal and state levels are imposed on the income of people, businesses,…
Q: The next dividend payment by Savitz, Incorporated, will be $3.05 per share. The dividends are…
A: Required rate is what one investor would expect to earn on investment in stock and the required rate…
Q: The 6-month and 1-year zero rates are both 5% per annum. For a bond that has a life of 18 months and…
A: The expectations theory refers to the calculation of long-term spot rates based on forward rates and…
Q: Murkywater Company is considering a lockbox system. Its collection delay is currently 12 days.…
A: Averagw daily collections means on an average how much amount is collected on daily basis. This is…
Q: Metallica Bearings, Incorporated, is a young start-up company. No dividends will be paid on the…
A: Dividend in Year 10 = d10 = $9Growth rate = g = 5%Required Rate of Return = r = 13%
Q: The toyota motor company is advertising a 24 month lease of 2014 camry for $189 payable at the…
A: Given is a simple scenario of Time value of money. The discount rate is given and there are…
Q: Monthly payments are required on a $35,000 loan at 6.0% compounded monthly. The loan has an…
A: A loan is a financial transaction where one party, typically a lender or financial institution,…
Q: Problem 6-11 This is a more difficult but informative problem. James Brodrick & Sons, Incorporated,…
A: A dividend is a payment of money, cash or maybe stock that a company makes to its shareholders. The…
Q: Rock Haven has a proposed project that will generate sales of 1770 units annually at a selling price…
A: Number of units sold= 1,770Selling price= $26Variable cost per unit= $7.55Fixed cost= $14900Fixed…
Q: What is the expected operating cash flow for year 2 of a project given the following information. To…
A: Operating Cash flow is that amount which is earned by the investor from the project. It includes the…
Q: You've collected the following information from your favorite financial website. 52-Week Price Lo…
A: Dividend yield is a financial metric that considers the cash dividends that is paid out to…
Q: Western Electric has 63,000 shares of common stock outstanding at a price per share of $70 and a…
A: The expense incurred by the corporation while obtaining money from the various sources of capital is…
Q: The stock price of BellsNWhistles is currently trading at $120. Over each of the next two six-month…
A: The binomial model is a discrete, step-by-step approach used in finance to find out the option…
Q: TargetCo has earnings per share of $3.90, 1.2 million shares, and a price per share of $38.10. If…
A: Q1Details of TargetCo,EPS=$3.90No. of shares=1.2 millionPrice per share=$38.10Multiples=16Q2Loki…
Q: Mr. Jones has a 2-stock portfolio with a total value of $560,000. $225,000 is invested in Stock A…
A: Standard deviation of portfolio comprising of two stocks is computed as follows:- SDp = where,SDp…
Q: West Coast Investing (WCI) is building a portfolio from three investments: 1, 2, and 3. WCI has 8…
A: Portfolio optimization is the process of constructing an investment portfolio that aims to achieve…
Q: d Hawk, Incorporated, is considering a change in its cash-only sales policy. The new terms of sale…
A: Company gives credit to the customers to increase the sales but that increase in sales is…
Q: the accrued interest (in $) and the total purchase price (in $) of the bond purchase
A: The question is based on the concept of Business Finance.We are given the following…
Q: ou were hired as a consultant to XYZ Company, whose target capital structure is 32% debt, 11%…
A: WACC better known as Weighted Average Cost of Capital is the summation of weighted average of…
Q: You are an employee of University Consultants, Limited, and have been given the following…
A: Here, Asking Price of Property $ 1,310,000.00Year 1 Rent of the Property $ 167,680.00Growth Rate…
Q: 8.5 You want to construct a bond portfolio to immunize the interest-rate risk of a liability of…
A: Macaulay duration is the time period an investor must hold the security so that the initial price…
Q: You decide to save $8000 per year from now on. You plan to retire in 30 years’ time. (a) How much…
A: The concept of time value of money will be used here. As per the concept of time value of money the…
Q: Replacement Analysis The Gilbert Instrument Corporation is considering replacing the wood steamer it…
A: After tax salvage value of a fixed asset is calculated as shown below.
Q: Part 1: Dallas Star Inc. 's stock has a 40% chance of producing a 5% return, and a 60% chance of…
A: The expected return is the estimation of profit or loss that an investor determines from his…
Q: Consider the following information regarding the performance of a money manager in a recent month.…
A: “Since you have posted a question with multiple sub parts, we will provide the solution only to the…
Q: A bicycle manufacturer currently produces 396,000 units a year and expects output levels to remain…
A: Here,Initial Investment $ 295,000.00Working Capital Required in Year 0 $ 54,000.00Sales Unit…
Q: Calculate the futures price
A: To determine the futures price, we first need to compute bond's current market price. Price of a…
Q: A borrower obtained a commercial loan for $4.5 million. The interest rate was fixed at 5.95% and had…
A: Loan amount = $4,500,000Interest rate = 5.95%Period = 25 years
Q: 21- Coupon Dond Pays annual Int. has Per 1000 mature in 4 yea has a coupon rate 10%. and YTM 12%.…
A: Bonds rate of return has two components One is the current yield that is how much is coupon against…
Q: Give typing answer with explanation and conclusion You are considering two possible marketing…
A: IRR refers to the rate of return at which the present value of future cash flow is equal to the…
Q: Currently Baldwin is paying a dividend of $18.83 (per share). If this dividend stayed the same, but…
A: Dividend- Dividend is the share of the profits which is given to the shareholders. The amount which…
Q: A company has purchased a machine (CCA rate 24%) at $221,000 and has a tax rate of 38.00%. By how…
A: NPV is a capital budgeting technique that uses the time value of money to determine the present…
Q: Use the Black Scholes formulas and Excel (to avoid rounding errors in the final answers) to answer…
A: Here,StockPrice is $44Strike Price is $40Time to Maturity is 4 monthsRiks Free Rate is 6%Standard…
Q: Pear Orchards is evaluating a new project that will require equipment of $249,000. The equipment…
A: Book value of the machine at the end of 4 years is calculated and then the after tax salvage value…
Q: Assume the spot Swiss franc is $0.7085 and the six-month forward rate is $0.7120. What is the Value…
A: Spot rate (S) = $0.7085Strike price ( k) = $0.6885Interest rate (r) = 3.5%Standard deviation (…
Q: The ABC stock currently stands at 5000 and has a volatility of 20% per annum. The risk-free rate of…
A: Current Price = P0 = $5000Volatality = σ = 20%Risk free interest rate = r = 4.25%Exercise price = E…
Q: hian, Inc. is considering a new 4-year expansion project that requires an initial fixed asset…
A: NPV is the net present value and an important capital budgeting method based on time value of money…
Q: Question A .Your company currently has $1,000 par, 6.25% coupon bonds with 10 years to maturity…
A: A bond is a kind of debt security issued by the government and private companies to the public for…
Q: 6.Calculate the project's Modified Internal Rate of Return (MIRR). What critical assumption does the…
A: The IRR & the MIRR of a project are indicative of the returns that the firm might be able to…
Q: ended task O Innovation Managing is the production of a novel and appropriate response, product or…
A: The correct option isOption 4: Creativity is the production of novel and appropriate responses. It…
Q: Problem 12-7 Calculating Returns and Variability [LO1] Year 1 2 3 Returns X 11% 15 10 Y 23% 26 11 4…
A: Here, ReturnsYearXY111%23%215%26%310%11%4-13%-14%510%16%
Q: Onipa Hia Mmoa Holdings bonds have an annual coupon payment of 7.25%. The bonds have a par value of…
A: Coupon rate = 7.25%Par value = 1000Bond price = 1125Maturity period = 13 years
Q: A manufacturer of video games develops a new game over two years. This costs $840,000 per year with…
A: The net present value (NPV) is a fundamental tool of capital budgeting. This tool enables investors…
Q: For the same Dollar General property shown above, forecast the rent after the first 5-year option…
A: Rent refers to the payment made by a tenant to a landlord or property owner in exchange for the use…
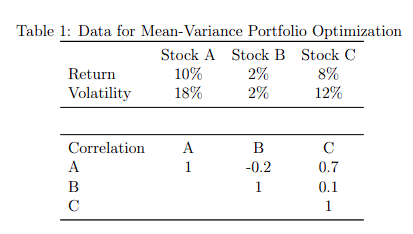
There are three stocks, A, B, and C, with the following expected return, volatility, and correlation data. You are asked to generate a mean-variance portfolio, the expected return of which should be no less than 8%. What’s your optimal allocation (portfolio weights) for those three stocks?

Step by step
Solved in 4 steps with 2 images


- Find out the 1- standard deviation 2- variance weight Investment*expected return stock weight Investment Investment Amount expected return stock stocks 0.261 1.45 75000 0.18 Alba Co. 0.0504 0.56 75000 0.09 Batelco Co. 0.0371 0.1 75000 0.371 Delmon poultry. 0.3485 225000 TotalSuppose that the index model for stocks A and B is estimated from excess returns with the following results: RA= 4.0% + 0.50RM + eA RB= -1.2% + 0.7RM + eB sigmaM= 17% ; R-squareA = 0.26 ; R-squareB= 0.18 Break down the variance of each stock to the systematic and firm-specific components (write in decimal form, rounded to 4 decimal places). Risk for A Risk for B Systematic Firm-specificReturns on stocks X and Y are listed below: Period 1 2 3 4 5 6 7 Stock X 7% 1% -2% -3% 5% 11% 5% Stock Y -4% 10% 4% 8% 7% -1% -3% Consider a portfolio of 70% stock X and 30% stock Y. What is the (population) variance of portfolio returns? Please round your answer to six decimal places. Note that the correct answer will be evaluated based on the full-precision result you would obtain using Excel.
- 11-3 Given the following information on a portfolio of Stock X and Stock Y, what is the portfolio standard deviation? Probability of boom state = 20% Probability of normal state = 80% Expected return on X = 13% Expected return on Y = 11% Variance on X = 0.0036 Variance on Y = 0.0144 Portfolio weight on X = 50% Portfolio weight on Y = 50% Correlation between X and Y = –1 Select one: a. 1% b. 2% c. 3% d. 6% e. 9%The standard deviation of return on stock A is 15% and the standard deviation on stock B is 15%. The correlation coefficient between the returns on stock A and B is -.25%. The rate of return for stocks A and B is 15% and 15% respectively. What is the standard deviation of return on the minimum-variance portfolio? a) 11.73% b) 12.00% c) 8.80% d) 9.35%Suppose the index model for stocks A and B is estimated with the following results: rA = 2% + 0.8RM + eA, rB = 2% + 1.2RM + eB, σM = 20%, and RM = rM − rf . The regression R2 of stocks A and B is 0.40 and 0.30, respectively. Answer the following questions. Total: (a) What is the variance of each stock? (b) What is the firm-specific risk of each stock? (c) What is the covariance between the two stocks?
- assume that the following data available for the portfolio, calculate the expected return, variance and standard deviation of the portfolio given stock A account for 45% an stock B account for 55% of you portfolio? A B Expexted return 12.5% 18.5% standard deviation of return 15% 20% correlation of cofficient(p) 0.4The following information are available: [3] Stock A Stock B Expected Return 16% 12% Standard Deviation 5% 8% Coefficient of Correlation 0.60 What is the co-variance between stock A & B? What is the expected return and risk of a portfolio in which A and B have weights of 0.60 and 0.40 respectively?Suppose that the index model for stocks A and B is estimated from excess returns with the following results:RA = 3% + .7RM + eARB = −2% + 1.2RM + eBσM = 20%; R-squareA = .20; R-squareB = .12Break down the variance of each stock into its systematic and firm-specific components.
- Given: Expected return Share A(ȓA) =15% Expected return Share B (ȓB) = 15% Expected return Portfolio A and B (ȓAB) = 15% By using the above information, demonstrate the rate of risk (variance and standard deviation) for each of: (i) Share A (ii) Share B (iii) Portfolio A and BSuppose the index model for stocks A and B is estimated with the following results:rA = 2% + 0.8RM + eA, rB = 2% + 1.2RM + eB , σM = 20%, and RM = rM − rf . The regressionR2 of stocks A and B is 0.40 and 0.30, respectively. Answer the following questions. (a) What is the variance of each stock? (b) What is the firm-specific risk of each stock? (c) What is the covariance between the two stocks?Suppose the index model for stocks A and B is estimated with the following results:rA = 2% + 0.8RM + eA, rB = 2% + 1.2RM + eB , σM = 20%, and RM = rM − rf . The regressionR2 of stocks A and B is 0.40 and 0.30, respectively.(a) What is the variance of each stock? (b) What is the firm-specific risk of each stock? (c) What is the covariance between the two stocks?
