ΤΑBLE 17.3 Densities of Selected Materials Material Mass Density (kg/m³) Specific Weight (kN/m³) Aluminum alloys 2600-2800 25.5-27.5 Brass 8400-8600 82.4-84.4 Bronze 8200-8800 80.4-86.3 Cast iron 7000-7400 68.7-72.5 Concrete Plain 2300 22.5 Reinforced 2400 23.5 Lightweight 1100–1800 10.8-17.7 Сopper 8900 87.3 Glass 2400-2800 23.5-27.5 Magnesium alloys Nickel 1760-1830 17.3-18.0 8800 86.3 Plastics Nylon 880-1100 8.6–10.8 Polyethylene 960-1400 9.4-13.7 Rock Granite, marble, quartz 2600-2900 25.5-28.4 Limestone, sandstone 2000-2900 19.6-28.4 Rubber 960-1300 9.4-12.7 Steel 7850 77.0 Titanium alloys 4500 44.1 lungsten 1900 18.6 Wood (air dry) Douglas fir 480-560 4.7-5.5 Oak 640-720 6.3-7.1 Southern pine 560-640 5.5-6.3 Based on Gere, Mechanics of Materials, SE. 2001, Cengage Learning. TABLE 17.4 The Strength of Selected Materials Material Yield Strength (MPa) Ultimate Strength (MPa) Aluminum alloys Brass 35-500 100-550 70-550 200-620 Bronze 82-690 200-830 Cast iron (tension) Cast iron (compression) Concrete (compression) Copper alloys 120-290 69-480 340-1400 10-70 55-760 230-830 Glass 30-1000 Plate glass 70 Glass fibers 7000-20,000 Magnesium alloys Nickel Plastics 80-280 140-340 100-620 310-760 Nylon 40-80 Polyethylene 7-28 Rock (compression) Granite, marble, quartz 50-280 Limestone, sandstone 20-200 Rubber 1-7 7-20 Steel High-strength 340-1000 550–1200 Machine 340-700 550-860 Spring 400-1600 700-1900 Stainless 280-700 400–1000 Тool 520 900 Steel wire 280-1000 550-1400 Structural steel 200-700 340-830 Titanium alloys 760–1000 900-1200 Tungsten 1400-4000 Wood (bending) Douglas fir 30-50 50-80
ΤΑBLE 17.3 Densities of Selected Materials Material Mass Density (kg/m³) Specific Weight (kN/m³) Aluminum alloys 2600-2800 25.5-27.5 Brass 8400-8600 82.4-84.4 Bronze 8200-8800 80.4-86.3 Cast iron 7000-7400 68.7-72.5 Concrete Plain 2300 22.5 Reinforced 2400 23.5 Lightweight 1100–1800 10.8-17.7 Сopper 8900 87.3 Glass 2400-2800 23.5-27.5 Magnesium alloys Nickel 1760-1830 17.3-18.0 8800 86.3 Plastics Nylon 880-1100 8.6–10.8 Polyethylene 960-1400 9.4-13.7 Rock Granite, marble, quartz 2600-2900 25.5-28.4 Limestone, sandstone 2000-2900 19.6-28.4 Rubber 960-1300 9.4-12.7 Steel 7850 77.0 Titanium alloys 4500 44.1 lungsten 1900 18.6 Wood (air dry) Douglas fir 480-560 4.7-5.5 Oak 640-720 6.3-7.1 Southern pine 560-640 5.5-6.3 Based on Gere, Mechanics of Materials, SE. 2001, Cengage Learning. TABLE 17.4 The Strength of Selected Materials Material Yield Strength (MPa) Ultimate Strength (MPa) Aluminum alloys Brass 35-500 100-550 70-550 200-620 Bronze 82-690 200-830 Cast iron (tension) Cast iron (compression) Concrete (compression) Copper alloys 120-290 69-480 340-1400 10-70 55-760 230-830 Glass 30-1000 Plate glass 70 Glass fibers 7000-20,000 Magnesium alloys Nickel Plastics 80-280 140-340 100-620 310-760 Nylon 40-80 Polyethylene 7-28 Rock (compression) Granite, marble, quartz 50-280 Limestone, sandstone 20-200 Rubber 1-7 7-20 Steel High-strength 340-1000 550–1200 Machine 340-700 550-860 Spring 400-1600 700-1900 Stainless 280-700 400–1000 Тool 520 900 Steel wire 280-1000 550-1400 Structural steel 200-700 340-830 Titanium alloys 760–1000 900-1200 Tungsten 1400-4000 Wood (bending) Douglas fir 30-50 50-80

Related questions
Question
As we discussed in this chapter, the strength-to-weight ratio of material is an important criterion when selecting material for aerospace applications. Calculate the average strength-toweight ratio for the following materials: aluminum alloy, titanium alloy, and steel. Use Tables 17.3 and 17.4 to look up appropriate values.
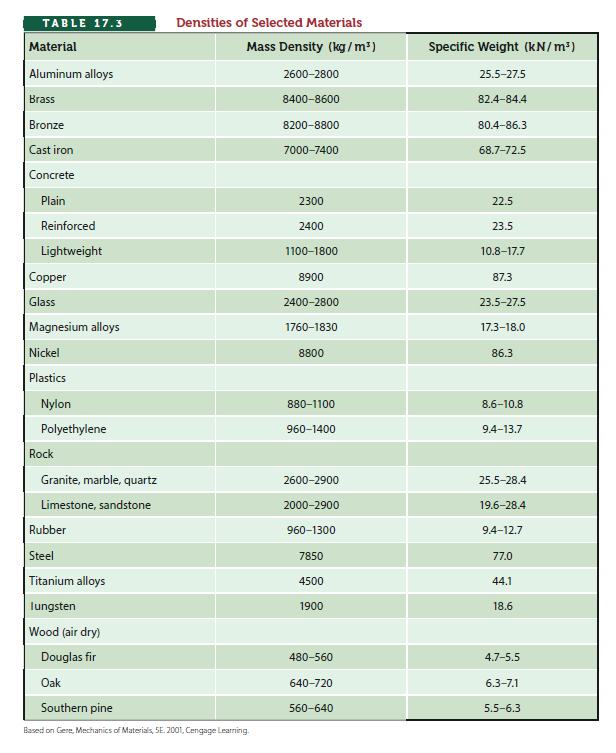
Transcribed Image Text:ΤΑBLE 17.3
Densities of Selected Materials
Material
Mass Density (kg/m³)
Specific Weight (kN/m³)
Aluminum alloys
2600-2800
25.5-27.5
Brass
8400-8600
82.4-84.4
Bronze
8200-8800
80.4-86.3
Cast iron
7000-7400
68.7-72.5
Concrete
Plain
2300
22.5
Reinforced
2400
23.5
Lightweight
1100–1800
10.8-17.7
Сopper
8900
87.3
Glass
2400-2800
23.5-27.5
Magnesium alloys
Nickel
1760-1830
17.3-18.0
8800
86.3
Plastics
Nylon
880-1100
8.6–10.8
Polyethylene
960-1400
9.4-13.7
Rock
Granite, marble, quartz
2600-2900
25.5-28.4
Limestone, sandstone
2000-2900
19.6-28.4
Rubber
960-1300
9.4-12.7
Steel
7850
77.0
Titanium alloys
4500
44.1
lungsten
1900
18.6
Wood (air dry)
Douglas fir
480-560
4.7-5.5
Oak
640-720
6.3-7.1
Southern pine
560-640
5.5-6.3
Based on Gere, Mechanics of Materials, SE. 2001, Cengage Learning.
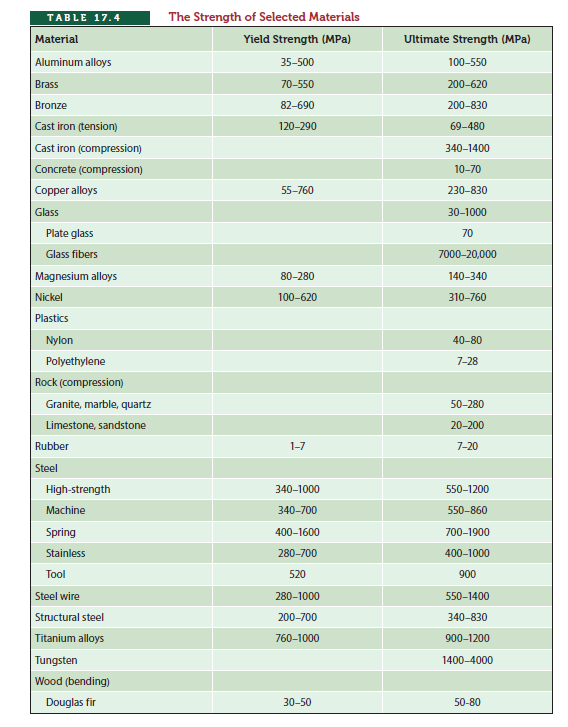
Transcribed Image Text:TABLE 17.4
The Strength of Selected Materials
Material
Yield Strength (MPa)
Ultimate Strength (MPa)
Aluminum alloys
Brass
35-500
100-550
70-550
200-620
Bronze
82-690
200-830
Cast iron (tension)
Cast iron (compression)
Concrete (compression)
Copper alloys
120-290
69-480
340-1400
10-70
55-760
230-830
Glass
30-1000
Plate glass
70
Glass fibers
7000-20,000
Magnesium alloys
Nickel
Plastics
80-280
140-340
100-620
310-760
Nylon
40-80
Polyethylene
7-28
Rock (compression)
Granite, marble, quartz
50-280
Limestone, sandstone
20-200
Rubber
1-7
7-20
Steel
High-strength
340-1000
550–1200
Machine
340-700
550-860
Spring
400-1600
700-1900
Stainless
280-700
400–1000
Тool
520
900
Steel wire
280-1000
550-1400
Structural steel
200-700
340-830
Titanium alloys
760–1000
900-1200
Tungsten
1400-4000
Wood (bending)
Douglas fir
30-50
50-80
Expert Solution
This question has been solved!
Explore an expertly crafted, step-by-step solution for a thorough understanding of key concepts.

This is a popular solution!

Trending now
This is a popular solution!

Step by step
Solved in 2 steps
