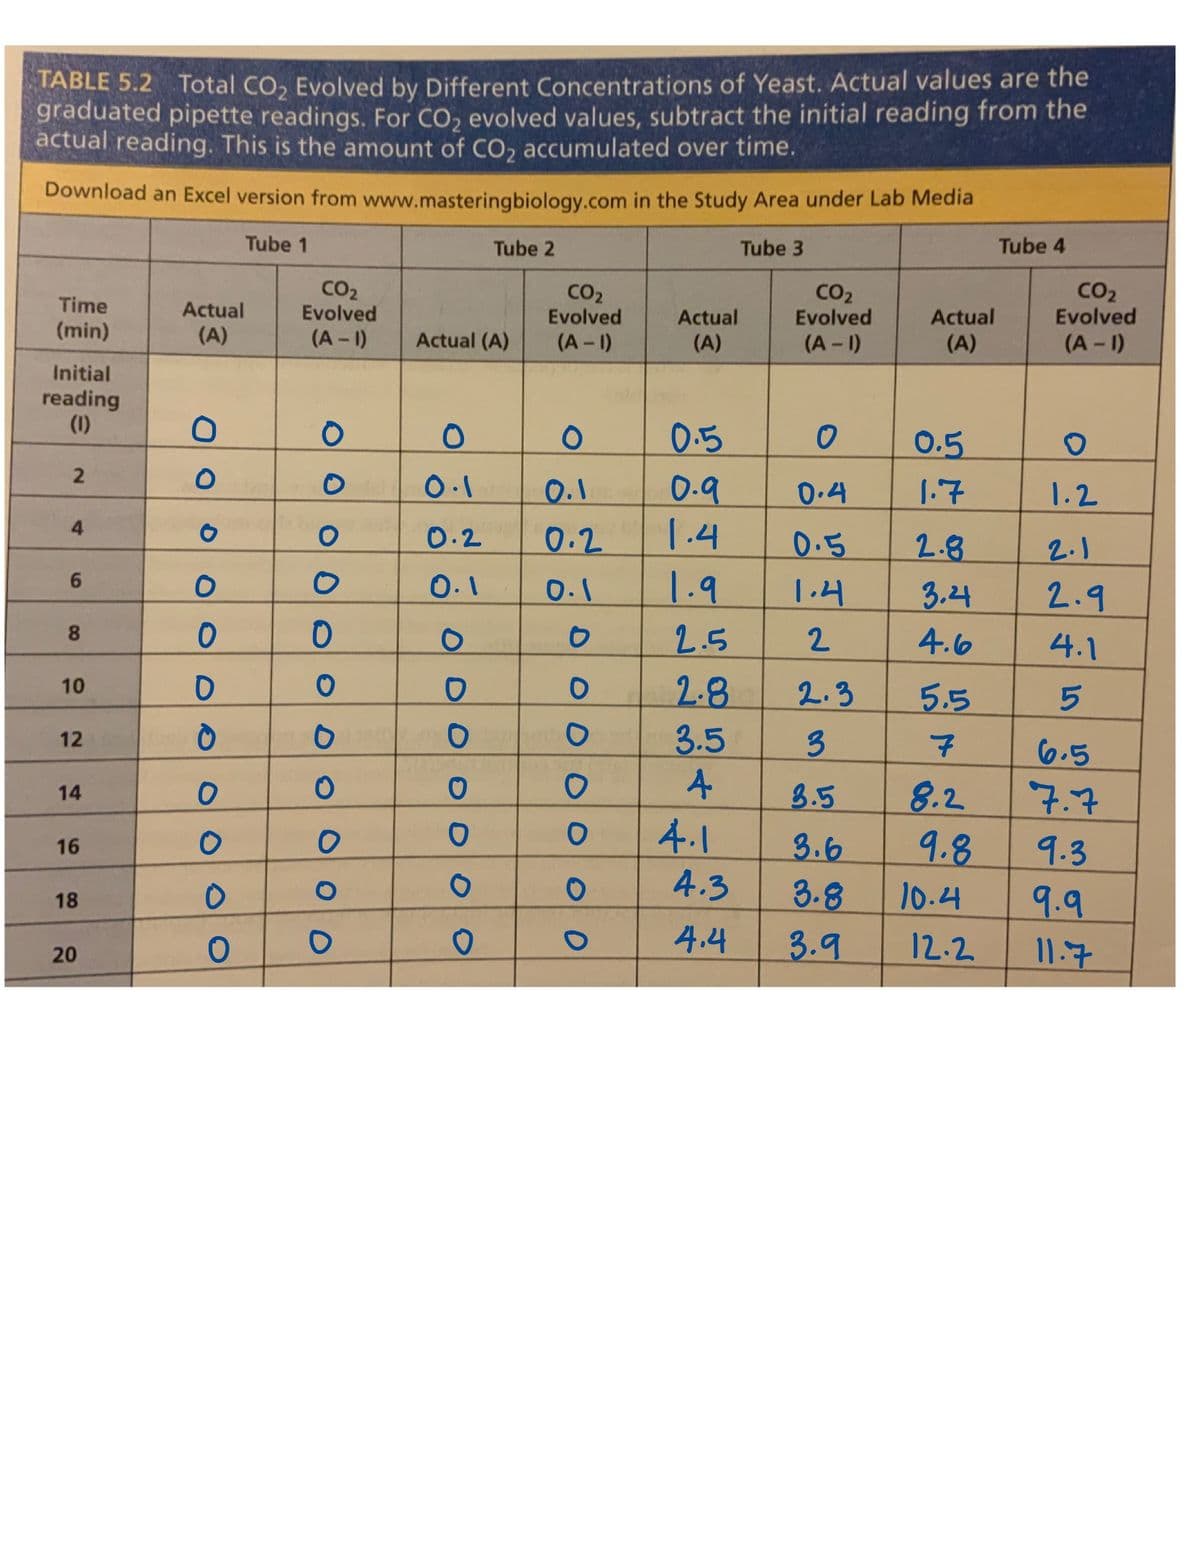
TABLE 5.2 Total CO, Evolved by Different Concentrations of Yeast. Actual values are the graduated pipette readings. For CO, evolved values, subtract the initial reading from the actual reading. This is the amount of CO, accumulated over time. Download an Excel version from www.masteringbiology.com in the Study Area under Lab Media Tube 1 Tube 2 Tube 3 Tube 4 CO2 Evolved CO2 Evolved CO2 CO2 Evolved Time Actual Actual Evolved Actual (min) (A) (A-1) Actual (A) (A - 1) (A) (A-1) (A) (A-1) Initial reading (1) 0.5 0.5 0.1 0.9 1.4 1.9 0.1 0.4 1.7 1.2 0.2 0.2 0.5 2.8 2.1 6 0.1 0.1 1.4 3.24 2.9 2.5 8 2 4.6 4.1 2.8 3.5 10 2.3 5.5 3. 12 6.5 8.2 9.8 10.4 8.5 7.7 14 4.1 3.6 9.3 16 4.3 3.8 9.9 18 4.4 3.9 12.2 11.7 20 2. 41
TABLE 5.2 Total CO, Evolved by Different Concentrations of Yeast. Actual values are the graduated pipette readings. For CO, evolved values, subtract the initial reading from the actual reading. This is the amount of CO, accumulated over time. Download an Excel version from www.masteringbiology.com in the Study Area under Lab Media Tube 1 Tube 2 Tube 3 Tube 4 CO2 Evolved CO2 Evolved CO2 CO2 Evolved Time Actual Actual Evolved Actual (min) (A) (A-1) Actual (A) (A - 1) (A) (A-1) (A) (A-1) Initial reading (1) 0.5 0.5 0.1 0.9 1.4 1.9 0.1 0.4 1.7 1.2 0.2 0.2 0.5 2.8 2.1 6 0.1 0.1 1.4 3.24 2.9 2.5 8 2 4.6 4.1 2.8 3.5 10 2.3 5.5 3. 12 6.5 8.2 9.8 10.4 8.5 7.7 14 4.1 3.6 9.3 16 4.3 3.8 9.9 18 4.4 3.9 12.2 11.7 20 2. 41

Chapter10: Reconstitution Of Powdered Drugs
Section: Chapter Questions
Problem 34SST

Related questions
Question
Looking at the chart, Tell:
a) What is (are) the indepednent variables? Which is the appropriate axis for this variable?
b) What is the dependent variable? Which is the appropriate axis for this variable?
c) Choose an appropriate scale and label the x and y axes. Should you use a legend? If so, what would this include?
Transcribed Image Text:TABLE 5.2 Total CO, Evolved by Different Concentrations of Yeast. Actual values are the
graduated pipette readings. For CO, evolved values, subtract the initial reading from the
actual reading. This is the amount of CO2 accumulated over time.
Download an Excel version from www.masteringbiology.com in the Study Area under Lab Media
Tube 1
Tube 2
Tube 3
Tube 4
CO2
Evolved
(A - 1)
CO2
Evolved
CO2
Evolved
CO2
Evolved
(A - 1)
Time
Actual
Actual
Actual
(min)
(A)
Actual (A)
(A-1)
(A)
(A- 1)
(A)
Initial
reading
(1)
0.5
0.5
0.1
0.9
1.4
1.9
0.1
0.4
1.7
1.2
4
0.2
0.2
0.5
2.8
2.1
6.
0.1
0.1
1.4
3.4
2.9
2.5
8.
2
4.6
4.1
2.8
3.5
10
2.3
5.5
12
3
7
6.5
구.구
8.2
9.8
10.4
14
8.5
4.1
3.6
9.3
16
4.3
3.8
9.9
11.7
18
4.4
3.9
12.2
20
O O O
O O O O
2.
Expert Solution
This question has been solved!
Explore an expertly crafted, step-by-step solution for a thorough understanding of key concepts.

This is a popular solution!

Trending now
This is a popular solution!

Step by step
Solved in 2 steps

Knowledge Booster


Learn more about
Need a deep-dive on the concept behind this application? Look no further. Learn more about this topic, biology and related others by exploring similar questions and additional content below.Recommended textbooks for you