Temperature vs Time graph 70 60 50 40 30 20 10 5 10 15 20 25 30 35 Time (min) Temperature (°C)

Q: Problem 2 Consider the block of mass m, connected to a spring of spring constant k and placed on a i...
A: 1. The block can oscillate as well as move on the inclined plane. The motion of the block can be spe...
Q: Two long straight aluminum wires, each of diameter 0.40 mm, carry the same current but in opposite d...
A: Given:
Q: Q2-Consider a filamentary wire is bent to form a square loop of side 3 m lying in the x -y plane as ...
A: Given data: current I=1(A), side, L=3(m) So equation for magnetic flux density at the center of the...
Q: an isolated atom of a certain element emits light of wavelength 520nm when the atom falls from its f...
A: Given, Planck's Constant,h=6.626×10⁻³⁴JsSpeed of light,c=3×10⁸m/sWavelength from fifth to second exc...
Q: An electric generator contains a coil of 100 turns of wire, each forming a rectangular loop 50.0 cm ...
A: Induced EMF or electromotive force is the potential difference developed in a coil due to change in ...
Q: 6. A spaceship of proper length L, = 54.0 m is moving relative to the Earth in the +x direction at a...
A: The proper length of the spaceship, as measured in its frame of reference is, Lo=54 m. As this space...
Q: QUESTIONS1. Define maximum power point of a solar module. 2. Define maximum power point tracker.
A: The objective is to give an definition about the maximum power point of a solar module
Q: How can you measure the rate at which you do work?
A: Given: To explain the measure the rate of work as,
Q: Two long straight aluminum wires, each of diameter 0.40 mm, carry the same current but in opposite d...
A: Given, Diameter, d= 0.4 mm Length, L= 1 m Density of aluminium, ρ=2.7 g/cm2=2700 kg/m3 Due to the cu...
Q: A 60.0-cm length of wire carries a current of 10.0 A. It is bent into a square loop and placed with ...
A: Torque on the given square loop is: ζ =NIAB sinθhere N = number of turnsI = currentA = area of the ...
Q: A 60.0-cm length of wire carries a current of 10.0 A. It is bent into an equilateral triangle loop a...
A: Given: The length of the wire L = 60 cm The current carried by the wire is I = 10 A The magnitude of...
Q: A wire 60.0 cm long is held parallel to and 100 cm above a long wire carrying 100 A and resting on t...
A: Given that,The length of wire (L) = 60 cm = 0.60 mThe speed of the wire = v (m/sec)The current (I) =...
Q: A 60.0-cm length of wire carries a current of 10.0 A. It is bent into an equilateral triangle loop a...
A: The torque on a current carrying loop with current I and area A is given by, τ=iAB (1) The ar...
Q: b. The electric field midway between two equal but opposite point charges is 1,750 N/C, and the dist...
A: Given: The electric field is given as 1,750 N/C The distance is 16 cm
Q: What's the speed of light ?
A: Given What's the speed of light, as following below.
Q: The fully balanced disk shown lo, m here is pivot pivoted at its centre, o, The disk has a mass m = ...
A: The situation can be drawn as below,
Q: 4. A certain star is a perfect sphere of radius R. Its density varies with radius according to p = A...
A: According to Gauss' Law the surface integral of Gravitational field is proportional to the mass cont...
Q: An 8-kg block E is attached to a pulley system as shown. If the end of the cable at A is pulled down...
A: Here, we use the constraint relations between the pulling point and the point E to get the required.
Q: An electric generator contains a coil of 100 turns of wire, each forming a rectangular loop 50.0 cm ...
A:
Q: Q3. Use NOR gates to implement each expression: (a) x = A+ B (b) X = AB
A: Given, NOR gates for implementation
Q: or an electron (you must decide ds 130 ns in the region. What is of B? Give your answer in T. 10-27 ...
A: Given: To find the magnitude of the B using the values as,
Q: Part A and B
A: Given focal length of the lens=25cm
Q: A charged particle moves into a region of uniform magnetic field, goes through half a circle, and th...
A: From the figure we can say the particle enters the region from top and magnetic field in the region ...
Q: A 40 kg box has an initial velocity of 6 m/s down a 30-degree inclined plane at an initial height of...
A: The free-body diagram for the problem is shown below: According to the conservation of energy, we h...
Q: Calculate the coefficient of linear expansion a for a 11.0 m metal bar that shortens by 0.500 cm whe...
A: Given: Initial length L0=11.0m Change in length is ∆L=0.500cm=0.500*10-2m. Initial temperature Ti=25...
Q: What is the expected color under ultraviolet light and what is the wavelength of fluorescence for Cd...
A: The energy is given by E=hcλ --(eq-1) Where E is energy, h is Planck constant, c is speed of light ...
Q: The segment of wire in the figure carries a current of I=8.00 A, where the radius of the circular ar...
A: Given, Current,I=8ARadius,R=4cm=4×10⁻²mμ0=12×10-7H/mπ=3 We have to calculate the magnetic field, We ...
Q: For a diffraction grating of 650 lines / mm, we detect the fourth order diffraction at the angle of ...
A: For the diffraction interference, the wavelength is given by the following relation. dsinθ=nλ ...
Q: Please answer question e only, thank you. An electron beam is accelerated across a potential differ...
A: It is a problem of The “Powder Method” e) The wave lentgh of the Electron is λ=1.23V nm We are give...
Q: The figure shows the light intensity on a screen behind a double slit. The slit spacing is 0.220mm a...
A: Given: Distance between two slit is d=0.220mm=0.220*10-3m a=2.20m
Q: You are one of two identical twins and you decide that you want to be 9.00 years younger than your t...
A:
Q: A powerful experimental sewing machine is powered by a mass spring system. This sewing macine is cap...
A: Sewing machine is mass-spring system and undergoes oscillation. It can be considered as a simple har...
Q: icle with charge q =
A: Given: To find the magnitude of the magnetic force in the charge as,
Q: Supply voltage: V1=10Vpp sin( 2πf ) Undercut frequency fc1=2137.5 Upper cut frequency fc2=34200 ...
A: Given: To find the RLC band filter circuit with the given values as,
Q: Q2. Determine the young's modulus of elasticity from the following test result on a steel rod: Rod d...
A: Young' modulus is a numerical constant used to describe elastic properties of a solid undergoing ten...
Q: What are gravitational waves and how do they work?
A: Question : What are gravitational waves and how do they work? Gravitational waves are distortions ...
Q: A long, thin solenoid has 900 turns per meter andradius 2.50 cm. The current in the solenoid is incr...
A: Given, Number of turns per meter n=900 radius R= 2.50 cm didt=36.0 A/s
Q: A rectangular loop of wire of sides W = 0.3 m and L = 0.7 m lying in xy plane carries a current of I...
A: Given that,The width of rectangular loop of wire (W) = 0.3 mThe length of rectangular loop of wire (...
Q: A long solenoid has 100 turns/cm and carries current i. An electron moves within the solenoid in a c...
A: Magnetic field inside a solenoid is given by, B=μ0NI where μ0 magnetic permittivity in vacuum, N num...
Q: A metal stick with mass 0.5 kg and length 0.6 m is at rest horizontally on conducting wires shown be...
A: According to Newton's second law
Q: (1 0 3 • Inertial tensor a body in the Cartesian coordinate system is equal to ÎI = I2 2 1). If the ...
A: K =12(PRINCIPAL MPMENT OF INERTIA)ω2K =12(1+4+4)Iω2=129Iω2
Q: A closed container with constant volume insulated against heat is divided into two compartments by a...
A: Given: Mass of water is m=2 kg. Initial pressure of system is P1=800 kPa. Initial temperature of th...
Q: I = 7 A current flows from the infinitely long wire along the y axis that intersects the z axis at t...
A: given: I = 7 A current flows from the infinitely long wire along the y axis that intersects the z ax...
Q: 2- Find the area under one arch of y = sin (x/2).
A: if we imagine the Sinusoidal curve we get the image that it is a semicircle in the first quadrant in...
Q: The activity of a sample of a radioisotope at some time is 10.7 mCi and 0.36 h later it is 7.80 mCi....
A: a)N=N0e-λt7.80=10.7e-λt0.72=e-λtln0.72=-λtλ=-ln0.72t=0.320.36×3600sec=2.4×10⁻⁴sec-1b)half timet1/2=l...
Q: An electron at point A as shown in the figure has a speed v, = 2.7 × 10° m/s. The distance between p...
A: Given, Mass of electron,me=9.109×10⁻³¹kgCharge,Q=1.602×10⁻¹⁹CVelocity,v0=2.7×10⁶m/sLength,l=9cm=9×10...
Q: The segment of wire in the figure carries a current of l=6.00 A, where the radius of the circular ar...
A: Given data:I=6 AR=3 cm=0.03 m The Magnetic field at the origin due to two straight wires is zero. No...
Q: Verify the numerical relationship between c, the speed of light, and ?0 and ?0, the permeability and...
A: The mathematical equation isc=(ε'×μ')-0.5Where ε'being the absolute permittivity of freespaceand μ' ...
Q: (1) THE FOLLOWING QUESTIONS ARE BASED ON THE INFORMATION GIVEN BELOW. A massive, uniform rod of leng...
A: A) Using conservation of energy, 12Iω2=Mgh1213ML2ω2=MgL2ω=3gL
Q: One of the following sentences is true: a) Linear momentum is not conserved for elastic collisions, ...
A: a) False b) false c) false d) True e) false f)false
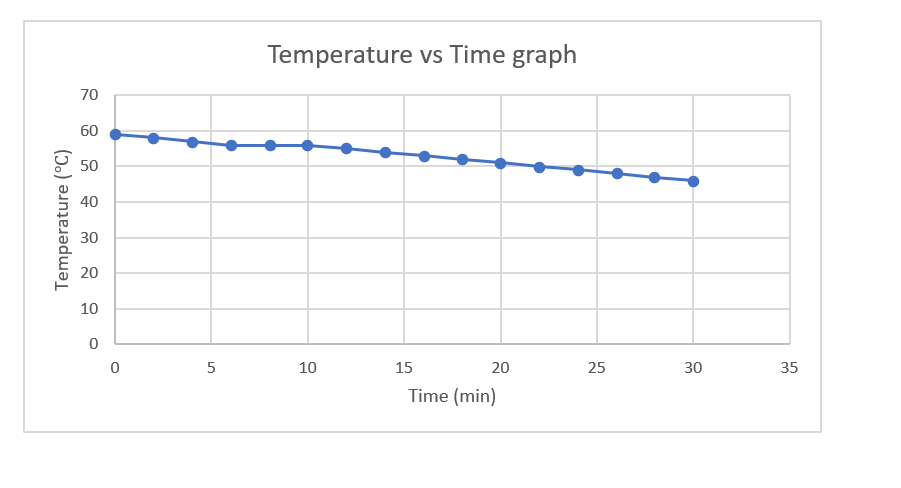
Experiment :
LEE’S DISC
I want the Analysis for this graph


Trending now
This is a popular solution!

Step by step
Solved in 2 steps
