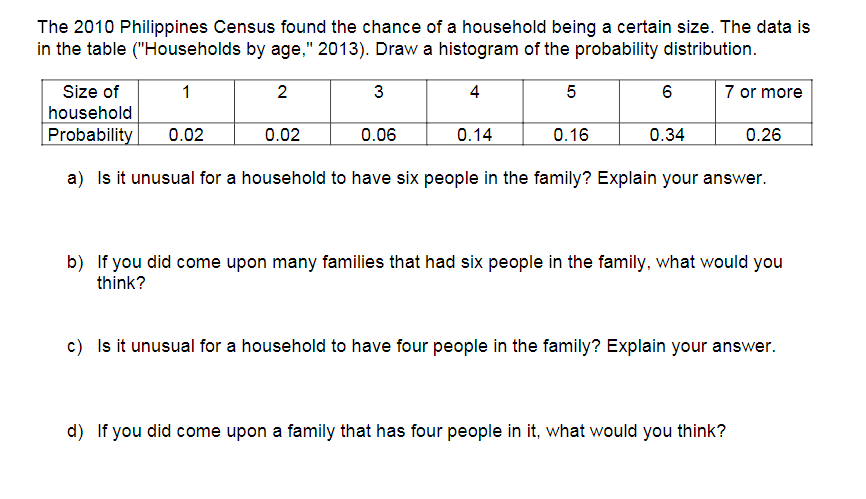
The 2010 Philippines Census found the chance of a household being a certain size. The data is in the table ("Households by age," 2013). Draw a histogram of the probability distribution. 7 or more Size of household 1 2 3 4 6 Probability 0.02 0.02 0.06 0.14 0.16 0.34 0.26 a) Is it unusual for a household to have six people in the family? Explain your answer. b) If you did come upon many families that had six people in the family, what would you think? c) Is it unusual for a household to have four people in the family? Explain your answer. d) If you did come upon a family that has four people in it, what would you think?
The 2010 Philippines Census found the chance of a household being a certain size. The data is in the table ("Households by age," 2013). Draw a histogram of the probability distribution. 7 or more Size of household 1 2 3 4 6 Probability 0.02 0.02 0.06 0.14 0.16 0.34 0.26 a) Is it unusual for a household to have six people in the family? Explain your answer. b) If you did come upon many families that had six people in the family, what would you think? c) Is it unusual for a household to have four people in the family? Explain your answer. d) If you did come upon a family that has four people in it, what would you think?

Chapter8: Sequences, Series,and Probability
Section8.7: Probability
Problem 11ECP: A manufacturer has determined that a machine averages one faulty unit for every 500 it produces....

Related questions
Question
Transcribed Image Text:The 2010 Philippines Census found the chance of a household being a certain size. The data is
in the table ("Households by age," 2013). Draw a histogram of the probability distribution.
Size of
1
2
3
4
5
7 or more
household
Probability
0.02
0.02
0.06
0.14
0.16
0.34
0.26
a) Is it unusual for a household to have six people in the family? Explain your answer.
b) If you did come upon many families that had six people in the family, what would you
think?
c) Is it unusual for a household to have four people in the family? Explain your answer.
d) If you did come upon a family that has four people in it, what would you think?
Expert Solution
This question has been solved!
Explore an expertly crafted, step-by-step solution for a thorough understanding of key concepts.

This is a popular solution!

Trending now
This is a popular solution!

Step by step
Solved in 4 steps with 1 images

Recommended textbooks for you