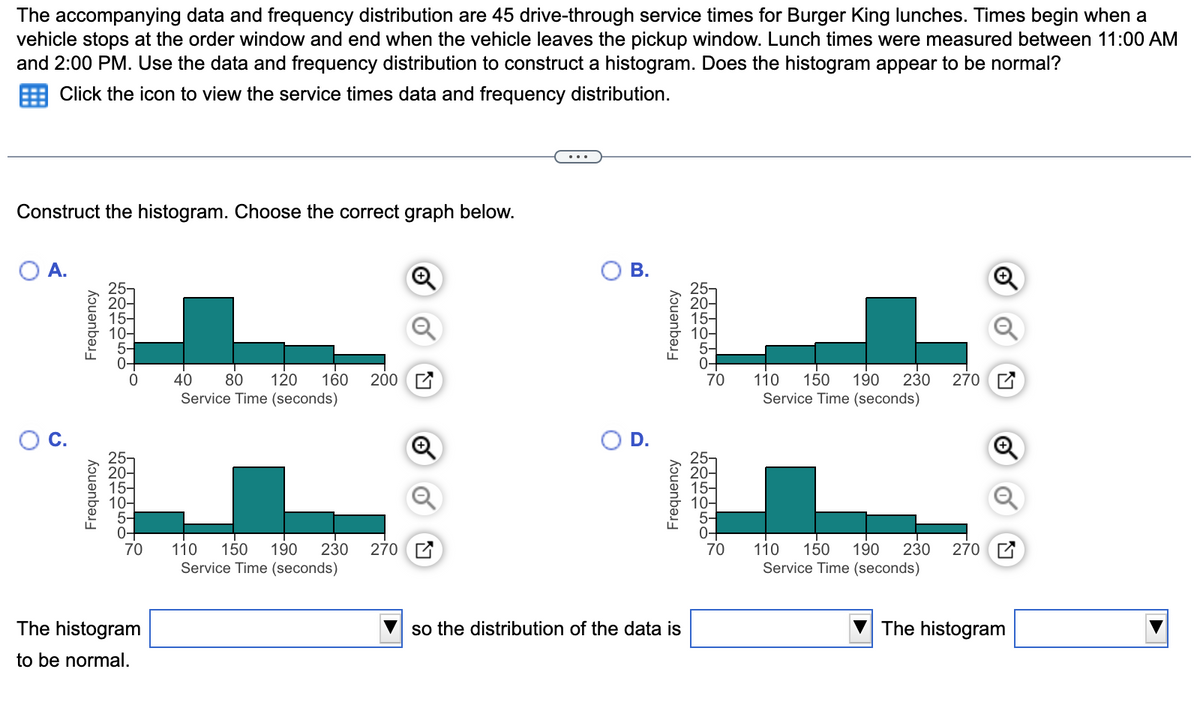
The accompanying data and frequency distribution are 45 drive-through service times for Burger King lunches. Times begin when a vehicle stops at the order window and end when the vehicle leaves the pickup window. Lunch times were measured between 11:00 AM and 2:00 PM. Use the data and frequency distribution to construct a histogram. Does the histogram appear to be normal? Click the icon to view the service times data and frequency distribution.
The accompanying data and frequency distribution are 45 drive-through service times for Burger King lunches. Times begin when a vehicle stops at the order window and end when the vehicle leaves the pickup window. Lunch times were measured between 11:00 AM and 2:00 PM. Use the data and frequency distribution to construct a histogram. Does the histogram appear to be normal? Click the icon to view the service times data and frequency distribution.

Glencoe Algebra 1, Student Edition, 9780079039897, 0079039898, 2018
18th Edition
ISBN:9780079039897
Author:Carter
Publisher:Carter
Chapter10: Statistics
Section10.6: Summarizing Categorical Data
Problem 42PFA

Related questions
Question
7.
Transcribed Image Text:The accompanying data and frequency distribution are 45 drive-through service times for Burger King lunches. Times begin when a
vehicle stops at the order window and end when the vehicle leaves the pickup window. Lunch times were measured between 11:00 AM
and 2:00 PM. Use the data and frequency distribution to construct a histogram. Does the histogram appear to be normal?
Click the icon to view the service times data and frequency distribution.
Construct the histogram. Choose the correct graph below.
A.
В.
20-
20-
10-
10-
40
80
120
160
200 E
70
110
270 E
150
190
Service Time (seconds)
230
Service Time (seconds)
С.
D.
25-
20-
15-
25-
20-
15-
270 E
270 E
190
150
Service Time (seconds)
70
110
230
70
110
150
190
230
Service Time (seconds)
The histogram
so the distribution of the data is
The histogram
to be normal.
Frequency
Frequency
B.
Frequency
Kɔuənbəu-
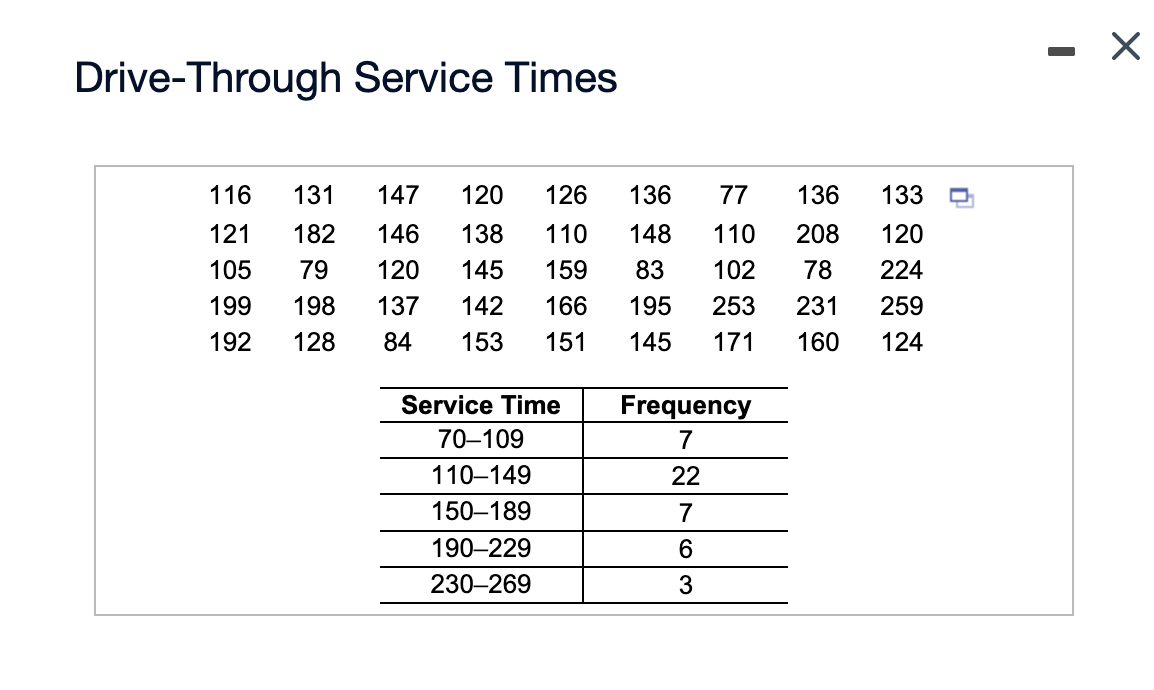
Transcribed Image Text:Drive-Through Service Times
116
131
147
120
126
136
77
136
133
121
182
146
138
110
148
110
208
120
105
79
120
145
159
83
102
78
224
199
198
137
142
166
195
253
231
259
192
128
84
153
151
145
171
160
124
Service Time
Frequency
70–109
7
110–149
22
150–189
7
190–229
230–269
Expert Solution
This question has been solved!
Explore an expertly crafted, step-by-step solution for a thorough understanding of key concepts.

This is a popular solution!

Trending now
This is a popular solution!

Step by step
Solved in 2 steps with 2 images

Recommended textbooks for you
Glencoe Algebra 1, Student Edition, 9780079039897…
Algebra
ISBN:
9780079039897
Author:
Carter
Publisher:
McGraw Hill

Big Ideas Math A Bridge To Success Algebra 1: Stu…
Algebra
ISBN:
9781680331141
Author:
HOUGHTON MIFFLIN HARCOURT
Publisher:
Houghton Mifflin Harcourt

Holt Mcdougal Larson Pre-algebra: Student Edition…
Algebra
ISBN:
9780547587776
Author:
HOLT MCDOUGAL
Publisher:
HOLT MCDOUGAL
Glencoe Algebra 1, Student Edition, 9780079039897…
Algebra
ISBN:
9780079039897
Author:
Carter
Publisher:
McGraw Hill
Big Ideas Math A Bridge To Success Algebra 1: Stu…
Algebra
ISBN:
9781680331141
Author:
HOUGHTON MIFFLIN HARCOURT
Publisher:
Houghton Mifflin Harcourt
Holt Mcdougal Larson Pre-algebra: Student Edition…
Algebra
ISBN:
9780547587776
Author:
HOLT MCDOUGAL
Publisher:
HOLT MCDOUGAL