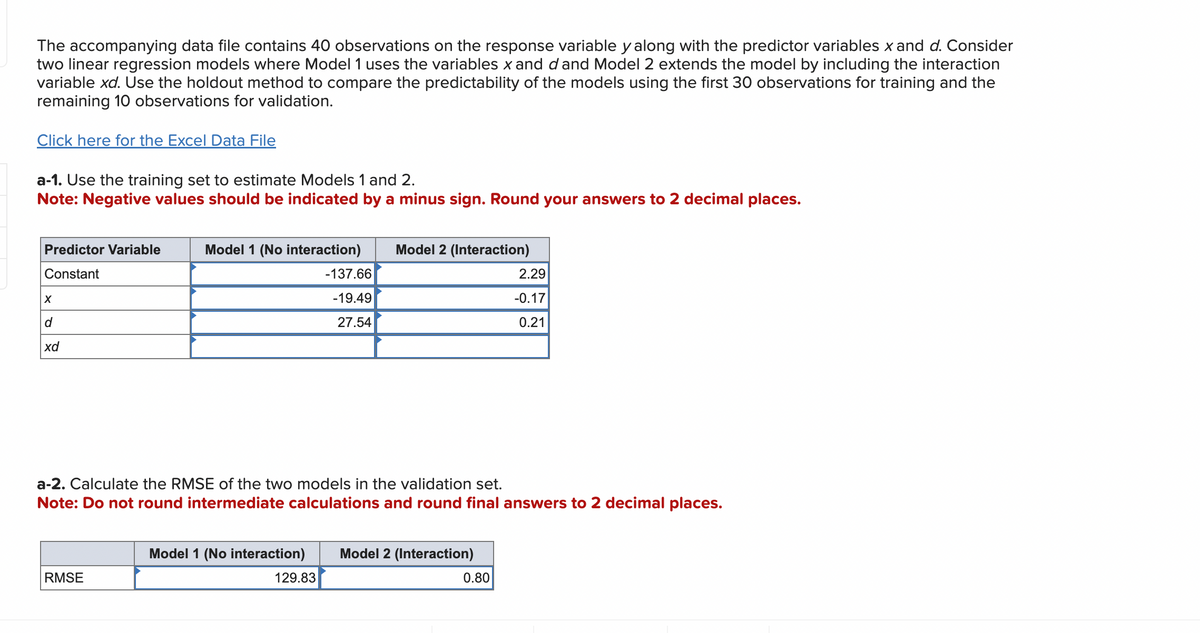
The accompanying data file contains 40 observations on the response variable y along with the predictor variables x and d. Consider two linear regression models where Model 1 uses the variables x and d and Model 2 extends the model by including the interaction variable xd. Use the holdout method to compare the predictability of the models using the first 30 observations for training and the remaining 10 observations for validation. Click here for the Excel Data File
The accompanying data file contains 40 observations on the response variable y along with the predictor variables x and d. Consider two linear regression models where Model 1 uses the variables x and d and Model 2 extends the model by including the interaction variable xd. Use the holdout method to compare the predictability of the models using the first 30 observations for training and the remaining 10 observations for validation. Click here for the Excel Data File

College Algebra
7th Edition
ISBN:9781305115545
Author:James Stewart, Lothar Redlin, Saleem Watson
Publisher:James Stewart, Lothar Redlin, Saleem Watson
Chapter1: Equations And Graphs
Section: Chapter Questions
Problem 10T: Olympic Pole Vault The graph in Figure 7 indicates that in recent years the winning Olympic men’s...

Related questions
Question
Transcribed Image Text:The accompanying data file contains 40 observations on the response variable y along with the predictor variables x and d. Consider
two linear regression models where Model 1 uses the variables x and d and Model 2 extends the model by including the interaction
variable xd. Use the holdout method to compare the predictability of the models using the first 30 observations for training and the
remaining 10 observations for validation.
Click here for the Excel Data File
a-1. Use the training set to estimate Models 1 and 2.
Note: Negative values should be indicated by a minus sign. Round your answers to 2 decimal places.
Predictor Variable
Constant
X
d
xd
Model 1 (No interaction)
RMSE
Model 1 (No interaction)
-137.66
-19.49
27.54
a-2. Calculate the RMSE of the two models in the validation set.
Note: Do not round intermediate calculations and round final answers to 2 decimal places.
129.83
Model 2 (Interaction)
Model 2 (Interaction)
2.29
-0.17
0.21
0.80
![Home
123456700
Paste
N8
1 y
70
102
72
83
61
62
67
9 98
10 84
11 101
12 51
13 108
14 32
15 71
16 101
17 90
18 112
19 88
20 110
21 95
22 44
23 51
24 112
25 113
26 52
27 61
28 100
29 78
30 90
31 57
32 59
33 53
34 119
35 109
36 68
37 104
38 45
39 72
40 65
41 74
42
43
44
A
Ready
·
Insert Draw Page Layout
X
11
19
12
14
17
13
20
16
11
15
16
16
13
15
17
15
19
13
18
17
14
19
17
17
13
10
16
14
16
16
15
15
19
18
11
19
18
17
15
14
B
E7-57
Calibri (Body)
B
d
1
1
1
1
0
0
0
1
1
1
0
1
0
1
1
1
1
1
1
1
0
0
1
1
0
1
1
1
1
0
0
0
1
1
0
1
0
0
0
1
fx
C
+
U
▼ 11
D
Accessibility: Good to go
E
Formulas
A- A-
F
G
Data Review
H
ab
I
▼
E+
View
J
Ch8_Q39_V03_Data_File (9).xlsx [Shared]
Acrobat
Wrap Text ▾
Merge & Center
K
L
General
M
%
N
.00
◆.0
.00 ➡.0
O
#
Conditional Format
Formatting as Table
P
Q
R
Cell
Styles
S
Insert ▾
Delete ▾
Format ▾
T
U
Σ
V
▼
V
AP
Sort & Find &
Filter Select
O
Q Search Sheet
Q.
W
A
I
Create and Share
Adobe PDF
X
+ Share ✔
Y
N
+ 100%
AA](/v2/_next/image?url=https%3A%2F%2Fcontent.bartleby.com%2Fqna-images%2Fquestion%2F758c0718-385d-4d64-add0-63f754532d5e%2F019a3abd-03fc-49f9-9286-eec11ea3254c%2Fmwqzbhg_processed.png&w=3840&q=75)
Transcribed Image Text:Home
123456700
Paste
N8
1 y
70
102
72
83
61
62
67
9 98
10 84
11 101
12 51
13 108
14 32
15 71
16 101
17 90
18 112
19 88
20 110
21 95
22 44
23 51
24 112
25 113
26 52
27 61
28 100
29 78
30 90
31 57
32 59
33 53
34 119
35 109
36 68
37 104
38 45
39 72
40 65
41 74
42
43
44
A
Ready
·
Insert Draw Page Layout
X
11
19
12
14
17
13
20
16
11
15
16
16
13
15
17
15
19
13
18
17
14
19
17
17
13
10
16
14
16
16
15
15
19
18
11
19
18
17
15
14
B
E7-57
Calibri (Body)
B
d
1
1
1
1
0
0
0
1
1
1
0
1
0
1
1
1
1
1
1
1
0
0
1
1
0
1
1
1
1
0
0
0
1
1
0
1
0
0
0
1
fx
C
+
U
▼ 11
D
Accessibility: Good to go
E
Formulas
A- A-
F
G
Data Review
H
ab
I
▼
E+
View
J
Ch8_Q39_V03_Data_File (9).xlsx [Shared]
Acrobat
Wrap Text ▾
Merge & Center
K
L
General
M
%
N
.00
◆.0
.00 ➡.0
O
#
Conditional Format
Formatting as Table
P
Q
R
Cell
Styles
S
Insert ▾
Delete ▾
Format ▾
T
U
Σ
V
▼
V
AP
Sort & Find &
Filter Select
O
Q Search Sheet
Q.
W
A
I
Create and Share
Adobe PDF
X
+ Share ✔
Y
N
+ 100%
AA
Expert Solution
This question has been solved!
Explore an expertly crafted, step-by-step solution for a thorough understanding of key concepts.

This is a popular solution!

Trending now
This is a popular solution!

Step by step
Solved in 6 steps

Recommended textbooks for you
College Algebra
Algebra
ISBN:
9781305115545
Author:
James Stewart, Lothar Redlin, Saleem Watson
Publisher:
Cengage Learning

Linear Algebra: A Modern Introduction
Algebra
ISBN:
9781285463247
Author:
David Poole
Publisher:
Cengage Learning

Glencoe Algebra 1, Student Edition, 9780079039897…
Algebra
ISBN:
9780079039897
Author:
Carter
Publisher:
McGraw Hill
College Algebra
Algebra
ISBN:
9781305115545
Author:
James Stewart, Lothar Redlin, Saleem Watson
Publisher:
Cengage Learning
Linear Algebra: A Modern Introduction
Algebra
ISBN:
9781285463247
Author:
David Poole
Publisher:
Cengage Learning
Glencoe Algebra 1, Student Edition, 9780079039897…
Algebra
ISBN:
9780079039897
Author:
Carter
Publisher:
McGraw Hill

Big Ideas Math A Bridge To Success Algebra 1: Stu…
Algebra
ISBN:
9781680331141
Author:
HOUGHTON MIFFLIN HARCOURT
Publisher:
Houghton Mifflin Harcourt