The accompanying data file shows the square footage and associated property taxes for 20 homes in an affluent suburb 30 miles outside of New York City. Click here for the Excel Data File a. Estimate a home's property taxes as a linear function of the size of the home (measured by its square footage). Note: Round your answers to 2 decimal places. Property taxes = + Size b. What proportion of the sample variation in property taxes is explained by the home's size? Note: Round your answer into 2 decimal places. Proportion of the sample variation % c. What proportion of the sample variation in property taxes is unexplained by the home's size? Note: Round your answer into 2 decimal places. Proportion of the sample variation %
The accompanying data file shows the square footage and associated property taxes for 20 homes in an affluent suburb 30 miles outside of New York City. Click here for the Excel Data File a. Estimate a home's property taxes as a linear function of the size of the home (measured by its square footage). Note: Round your answers to 2 decimal places. Property taxes = + Size b. What proportion of the sample variation in property taxes is explained by the home's size? Note: Round your answer into 2 decimal places. Proportion of the sample variation % c. What proportion of the sample variation in property taxes is unexplained by the home's size? Note: Round your answer into 2 decimal places. Proportion of the sample variation %

Essentials of Business Analytics (MindTap Course List)
2nd Edition
ISBN:9781305627734
Author:Jeffrey D. Camm, James J. Cochran, Michael J. Fry, Jeffrey W. Ohlmann, David R. Anderson
Publisher:Jeffrey D. Camm, James J. Cochran, Michael J. Fry, Jeffrey W. Ohlmann, David R. Anderson
Chapter6: Statistical Inference
Section: Chapter Questions
Problem 8P

Related questions
Question
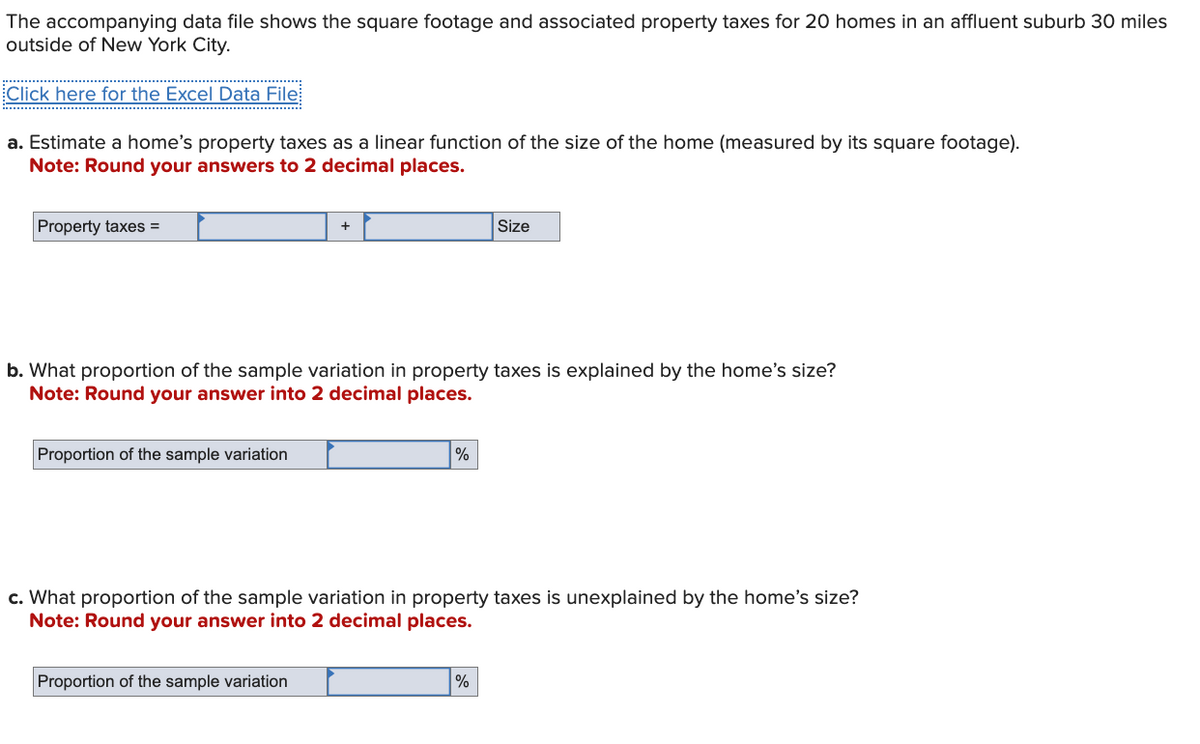
Transcribed Image Text:The accompanying data file shows the square footage and associated property taxes for 20 homes in an affluent suburb 30 miles
outside of New York City.
Click here for the Excel Data File
a. Estimate a home's property taxes as a linear function of the size of the home (measured by its square footage).
Note: Round your answers to 2 decimal places.
Property taxes =
+
Size
b. What proportion of the sample variation in property taxes is explained by the home's size?
Note: Round your answer into 2 decimal places.
Proportion of the sample variation
%
c. What proportion of the sample variation in property taxes is unexplained by the home's size?
Note: Round your answer into 2 decimal places.
Proportion of the sample variation
%
Expert Solution
This question has been solved!
Explore an expertly crafted, step-by-step solution for a thorough understanding of key concepts.

Step by step
Solved in 2 steps with 3 images

Recommended textbooks for you
Essentials of Business Analytics (MindTap Course …
Statistics
ISBN:
9781305627734
Author:
Jeffrey D. Camm, James J. Cochran, Michael J. Fry, Jeffrey W. Ohlmann, David R. Anderson
Publisher:
Cengage Learning

Essentials of Business Analytics (MindTap Course …
Statistics
ISBN:
9781305627734
Author:
Jeffrey D. Camm, James J. Cochran, Michael J. Fry, Jeffrey W. Ohlmann, David R. Anderson
Publisher:
Cengage Learning