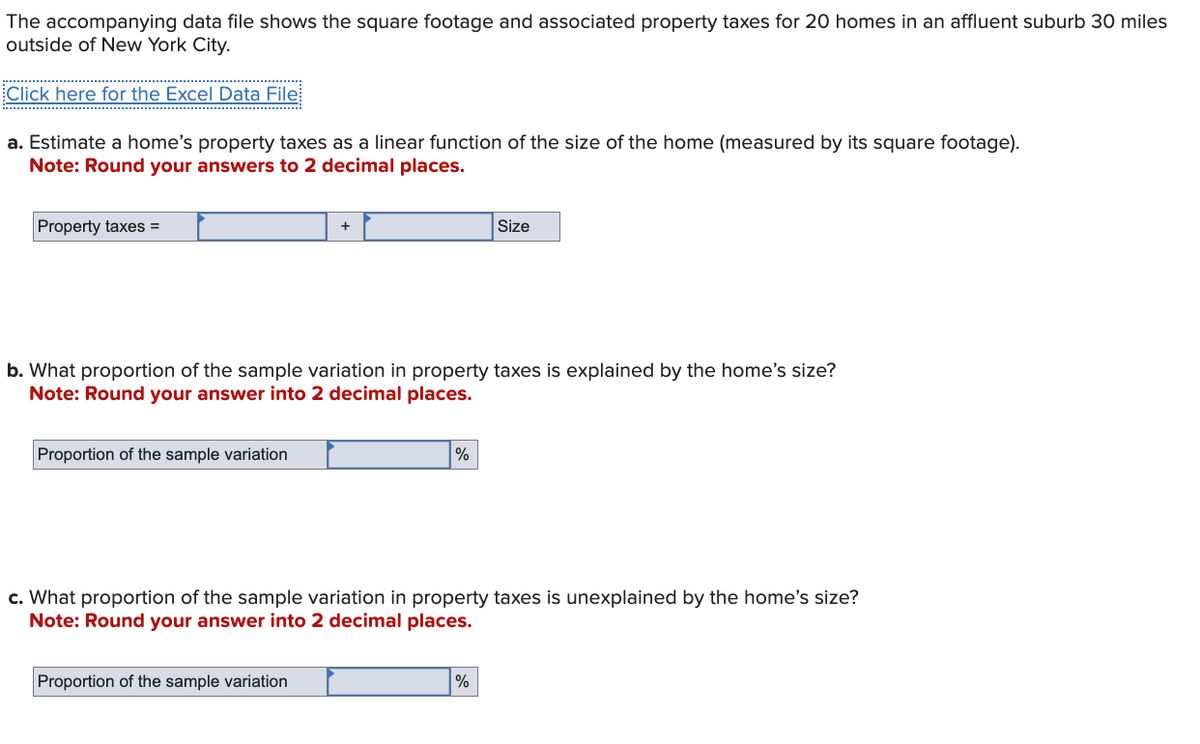
The accompanying data file shows the square footage and associated property taxes for 20 homes in an affluent suburb 30 miles outside of New York City. Click here for the Excel Data File a. Estimate a home's property taxes as a linear function of the size of the home (measured by its square footage). Note: Round your answers to 2 decimal places. Property taxes = + Size b. What proportion of the sample variation in property taxes is explained by the home's size? Note: Round your answer into 2 decimal places. Proportion of the sample variation % c. What proportion of the sample variation in property taxes is unexplained by the home's size? Note: Round your answer into 2 decimal places. Proportion of the sample variation %
The accompanying data file shows the square footage and associated property taxes for 20 homes in an affluent suburb 30 miles outside of New York City. Click here for the Excel Data File a. Estimate a home's property taxes as a linear function of the size of the home (measured by its square footage). Note: Round your answers to 2 decimal places. Property taxes = + Size b. What proportion of the sample variation in property taxes is explained by the home's size? Note: Round your answer into 2 decimal places. Proportion of the sample variation % c. What proportion of the sample variation in property taxes is unexplained by the home's size? Note: Round your answer into 2 decimal places. Proportion of the sample variation %

Practical Management Science
6th Edition
ISBN:9781337406659
Author:WINSTON, Wayne L.
Publisher:WINSTON, Wayne L.
Chapter14: Data Mining
Section14.2: Classification Methods
Problem 4P

Related questions
Question
| Property_Taxes | Size |
| 21948 | 2492 |
| 17345 | 2514 |
| 18226 | 1894 |
| 15715 | 1105 |
| 43992 | 5656 |
| 33602 | 2561 |
| 15231 | 2173 |
| 16621 | 1984 |
| 18264 | 2071 |
| 16075 | 1280 |
| 15244 | 1354 |
| 35972 | 2994 |
| 31033 | 2871 |
| 42035 | 3357 |
| 14397 | 1591 |
| 38983 | 4014 |
| 25319 | 4050 |
| 22862 | 2454 |
| 16144 | 3545 |
| 29262 | 2797 |
Transcribed Image Text:The accompanying data file shows the square footage and associated property taxes for 20 homes in an affluent suburb 30 miles
outside of New York City.
Click here for the Excel Data File
a. Estimate a home's property taxes as a linear function of the size of the home (measured by its square footage).
Note: Round your answers to 2 decimal places.
Property taxes =
+
Size
b. What proportion of the sample variation in property taxes is explained by the home's size?
Note: Round your answer into 2 decimal places.
Proportion of the sample variation
%
c. What proportion of the sample variation in property taxes is unexplained by the home's size?
Note: Round your answer into 2 decimal places.
Proportion of the sample variation
%
Expert Solution
This question has been solved!
Explore an expertly crafted, step-by-step solution for a thorough understanding of key concepts.

This is a popular solution!

Trending now
This is a popular solution!

Step by step
Solved in 2 steps with 2 images

Recommended textbooks for you
Practical Management Science
Operations Management
ISBN:
9781337406659
Author:
WINSTON, Wayne L.
Publisher:
Cengage,
Practical Management Science
Operations Management
ISBN:
9781337406659
Author:
WINSTON, Wayne L.
Publisher:
Cengage,