The accompanying data table contains chest deceleration measurements (in g, where g is the force of gravity) from samples of small, midsize, and large cars. Shown are the technology results for analysis of variance e that a researcher plans to use a 0.05 significance level to test the claim that the different size categories have the same mean chest deceleration in the standard crash test. Complete parts (a) and (b) below. this data table. Assume E Click the icon to view the table of chest deceleration measurements E Click the icon to view the table of analysis of variance results. a. What characteristic of the data specifically indicates that one-way analysis of variance should be used? O A. The population means are approximately normal. O B. There are three samples of measurements. Oc. The measurements are categorized according to the one characteristic of size. O D. Nothing specifically indicates that one-way analysis of variance should be used. b. If the objective is to test the claim that the three size categories have the same mean chest deceleration, why is the method referred to as analysis of variance? O A. The method is based on estimates of a common population variance. - X More Info O B. The method is based on showing that the population variances are similar. OC. The method is based on showing that the population variances are different. O D. The method is based on estimates of multiple varying population variances. Chest Deceleration Measurements (g) from a Standard Crash Test Small Midsize Large 44 39 37 54 39 44 42 36 53 43 42 52 49 41 32 45 41 38 37 38 33
The accompanying data table contains chest deceleration measurements (in g, where g is the force of gravity) from samples of small, midsize, and large cars. Shown are the technology results for analysis of variance e that a researcher plans to use a 0.05 significance level to test the claim that the different size categories have the same mean chest deceleration in the standard crash test. Complete parts (a) and (b) below. this data table. Assume E Click the icon to view the table of chest deceleration measurements E Click the icon to view the table of analysis of variance results. a. What characteristic of the data specifically indicates that one-way analysis of variance should be used? O A. The population means are approximately normal. O B. There are three samples of measurements. Oc. The measurements are categorized according to the one characteristic of size. O D. Nothing specifically indicates that one-way analysis of variance should be used. b. If the objective is to test the claim that the three size categories have the same mean chest deceleration, why is the method referred to as analysis of variance? O A. The method is based on estimates of a common population variance. - X More Info O B. The method is based on showing that the population variances are similar. OC. The method is based on showing that the population variances are different. O D. The method is based on estimates of multiple varying population variances. Chest Deceleration Measurements (g) from a Standard Crash Test Small Midsize Large 44 39 37 54 39 44 42 36 53 43 42 52 49 41 32 45 41 38 37 38 33
Glencoe Algebra 1, Student Edition, 9780079039897, 0079039898, 2018
18th Edition
ISBN:9780079039897
Author:Carter
Publisher:Carter
Chapter10: Statistics
Section10.4: Distributions Of Data
Problem 19PFA
Related questions
Question
6.

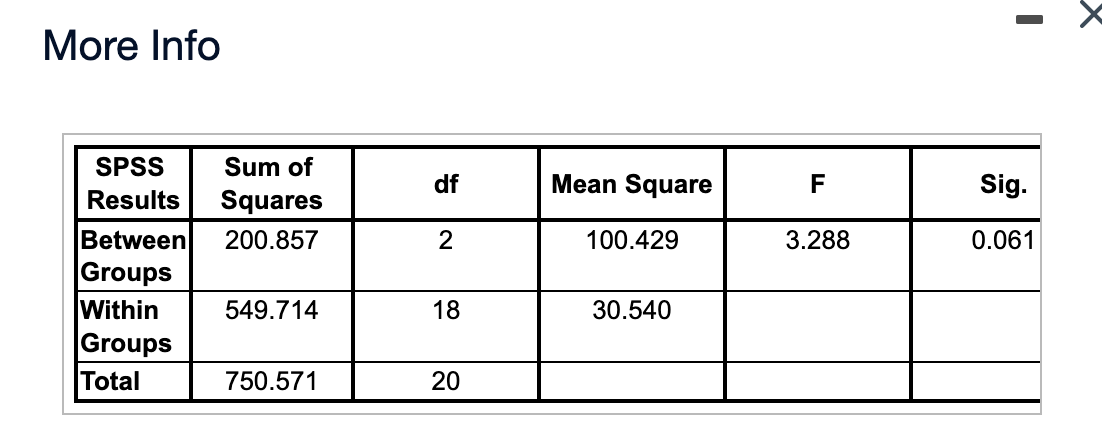
Transcribed Image Text:More Info
SPSS
Sum of
df
Mean Square
F
Sig.
Results
Squares
Between
Groups
Within
Groups
Total
200.857
2
100.429
3.288
0.061
549.714
18
30.540
750.571
20

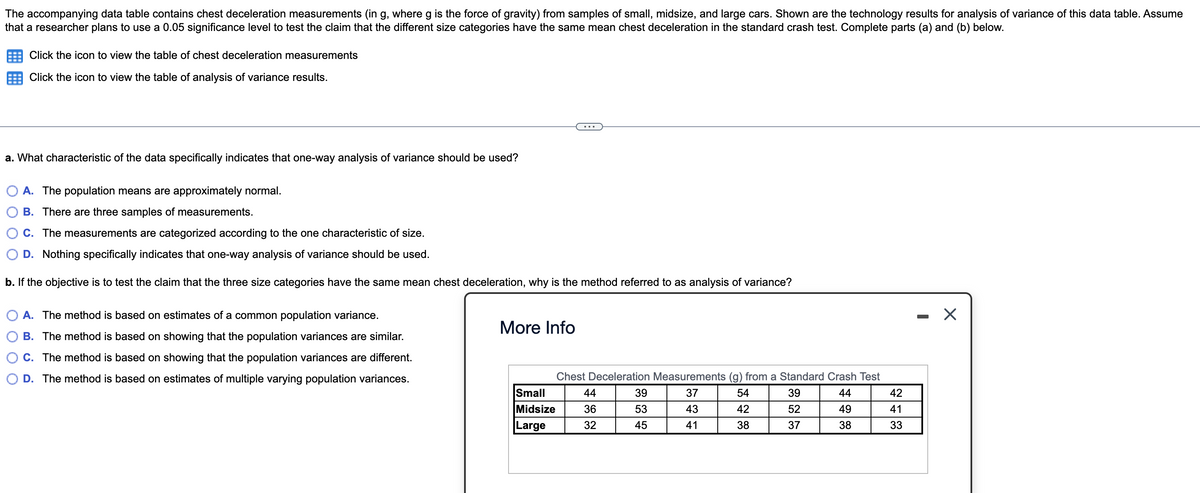
Transcribed Image Text:The accompanying data table contains chest deceleration measurements (in g, whereg is the force of gravity) from samples of small, midsize, and large cars. Shown are the technology results for analysis of variance of this data table. Assume
that a researcher plans to use a 0.05 significance level to test the claim that the different size categories have the same mean chest deceleration in the standard crash test. Complete parts (a) and (b) below.
Click the icon to view the table of chest deceleration measurements
Click the icon to view the table of analysis of variance results.
a. What characteristic of the data specifically indicates that one-way analysis of variance should be used?
A. The population means are approximately normal.
B. There are three samples of measurements.
C. The measurements are categorized according to the one characteristic of size.
O D. Nothing specifically indicates that one-way analysis of variance should be used.
b. If the objective is to test the claim that the three size categories have the same mean chest deceleration, why is the method referred to as analysis of variance?
O A. The method is based on estimates of a common population variance.
More Info
B. The method is based on showing that the population variances are similar.
C. The method is based on showing that the population variances are different.
D. The method is based on estimates of multiple varying population variances.
Chest Deceleration Measurements (g) from a Standard Crash Test
Small
44
39
37
54
39
44
42
Midsize
36
53
43
42
52
49
41
Large
32
45
41
38
37
38
33
O O O O
Expert Solution
This question has been solved!
Explore an expertly crafted, step-by-step solution for a thorough understanding of key concepts.
Step by step
Solved in 4 steps

Recommended textbooks for you

Glencoe Algebra 1, Student Edition, 9780079039897…
Algebra
ISBN:
9780079039897
Author:
Carter
Publisher:
McGraw Hill

Glencoe Algebra 1, Student Edition, 9780079039897…
Algebra
ISBN:
9780079039897
Author:
Carter
Publisher:
McGraw Hill