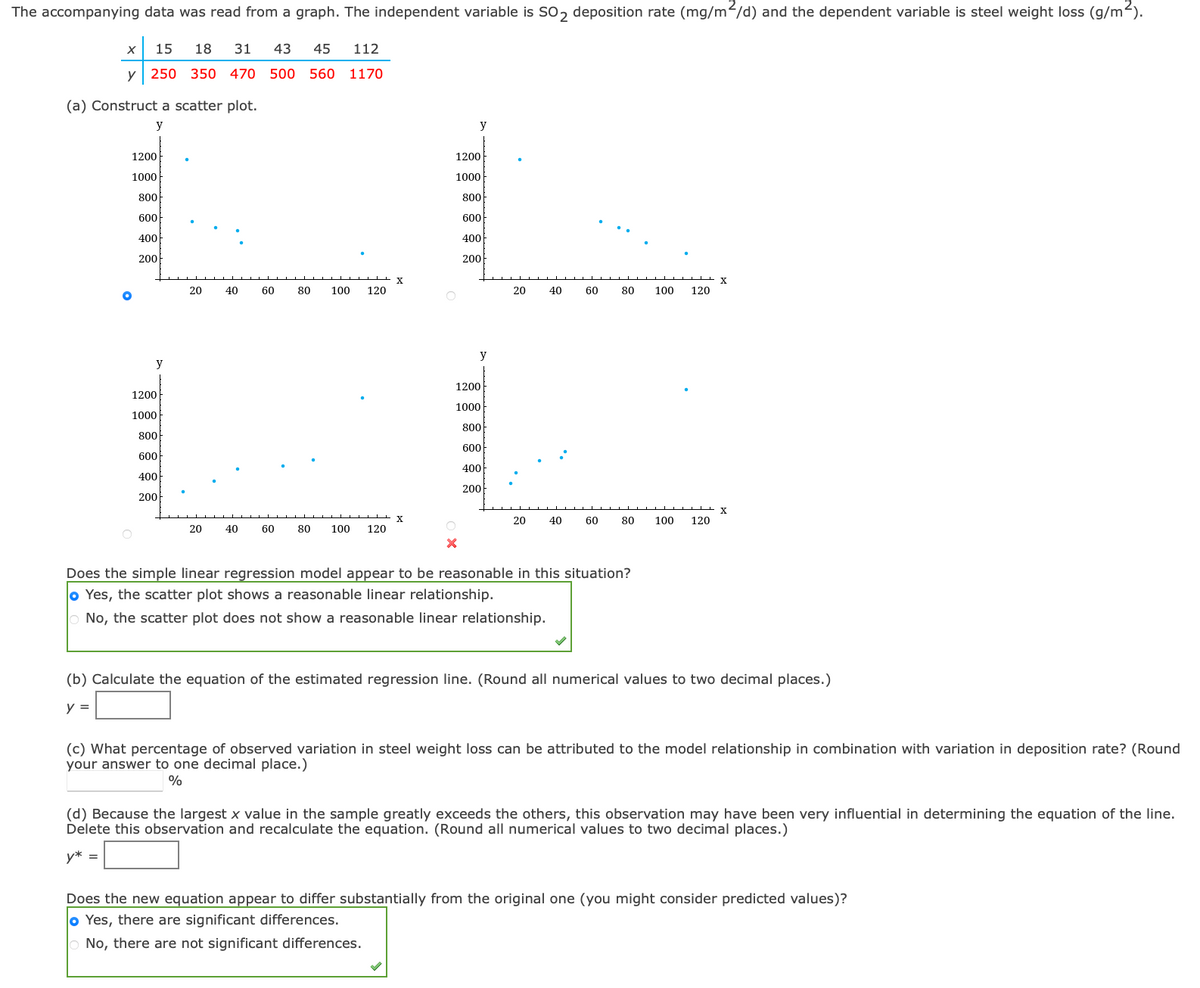
The accompanying data was read from a graph. The independent variable is SO2 deposition rate (mg/m²/d) and the dependent variable is steel weight loss (g/m²). x 15 18 31 43 45 112 y 250 350 470 500 560 1170 (a) Construct a scatter plot. y 1200 1000 800 600 400 200 O y 1200 1000 800 600 400 200 20 40 60 20 40 60 80 100 120 80 100 120 X X y 1200 1000 800 x 600 400 200 y 1200 1000 800 600 400 200 20 40 20 40 60 60 80 100 120 80 100 120 Does the simple linear regression model appear to be reasonable in this situation? o Yes, the scatter plot shows a reasonable linear relationship. No, the scatter plot does not show a reasonable linear relationship. X X (b) Calculate the equation of the estimated regression line. (Round all numerical values to two decimal places.) y = (c) What percentage of observed variation in steel weight loss can be attributed to the model relationship in combination with variation in deposition rate? (Round your answer to one decimal place.) % (d) Because the largest x value in the sample greatly exceeds the others, this observation may have been very influential in determining the equation of the line. Delete this observation and recalculate the equation. (Round all numerical values to two decimal places.) y* = Does the new equation appear to differ substantially from the original one (you might consider predicted values)? o Yes, there are significant differences. No, there are not significant differences.
The accompanying data was read from a graph. The independent variable is SO2 deposition rate (mg/m²/d) and the dependent variable is steel weight loss (g/m²). x 15 18 31 43 45 112 y 250 350 470 500 560 1170 (a) Construct a scatter plot. y 1200 1000 800 600 400 200 O y 1200 1000 800 600 400 200 20 40 60 20 40 60 80 100 120 80 100 120 X X y 1200 1000 800 x 600 400 200 y 1200 1000 800 600 400 200 20 40 20 40 60 60 80 100 120 80 100 120 Does the simple linear regression model appear to be reasonable in this situation? o Yes, the scatter plot shows a reasonable linear relationship. No, the scatter plot does not show a reasonable linear relationship. X X (b) Calculate the equation of the estimated regression line. (Round all numerical values to two decimal places.) y = (c) What percentage of observed variation in steel weight loss can be attributed to the model relationship in combination with variation in deposition rate? (Round your answer to one decimal place.) % (d) Because the largest x value in the sample greatly exceeds the others, this observation may have been very influential in determining the equation of the line. Delete this observation and recalculate the equation. (Round all numerical values to two decimal places.) y* = Does the new equation appear to differ substantially from the original one (you might consider predicted values)? o Yes, there are significant differences. No, there are not significant differences.

Algebra & Trigonometry with Analytic Geometry
13th Edition
ISBN:9781133382119
Author:Swokowski
Publisher:Swokowski
Chapter7: Analytic Trigonometry
Section7.6: The Inverse Trigonometric Functions
Problem 91E

Related questions
Question
Transcribed Image Text:The accompanying data was read from a graph. The independent variable is SO2 deposition rate (mg/m²/d) and the dependent variable is steel weight loss (g/m²).
15 18
31 43 45 112
y 250 350 470 500 560 1170
X
(a) Construct a scatter plot.
y
1200
1000
800
600
400
200
y
1200
1000
800
600
400
200
20
40
20 40
60
60
80 100
120
80 100 120
X
X
y
1200
1000
800
600
400
200
X
y
1200
1000
800
600
400
200
20
20
40
40
60
60
80 100 120
80
Does the simple linear regression model appear to be reasonable in this situation?
o Yes, the scatter plot shows a reasonable linear relationship.
No, the scatter plot does not show a reasonable linear relationship.
100 120
X
X
(b) Calculate the equation of the estimated regression line. (Round all numerical values to two decimal places.)
y =
(c) What percentage of observed variation in steel weight loss can be attributed to the model relationship in combination with variation in deposition rate? (Round
your answer to one decimal place.)
%
(d) Because the largest x value in the sample greatly exceeds the others, this observation may have been very influential in determining the equation of the line.
Delete this observation and recalculate the equation. (Round all numerical values to two decimal places.)
y* =
Does the new equation appear to differ substantially from the original one (you might consider predicted values)?
o Yes, there are significant differences.
No, there are not significant differences.
Expert Solution
This question has been solved!
Explore an expertly crafted, step-by-step solution for a thorough understanding of key concepts.

This is a popular solution!

Trending now
This is a popular solution!

Step by step
Solved in 5 steps with 2 images

Recommended textbooks for you
Algebra & Trigonometry with Analytic Geometry
Algebra
ISBN:
9781133382119
Author:
Swokowski
Publisher:
Cengage

Trigonometry (MindTap Course List)
Trigonometry
ISBN:
9781337278461
Author:
Ron Larson
Publisher:
Cengage Learning

Algebra & Trigonometry with Analytic Geometry
Algebra
ISBN:
9781133382119
Author:
Swokowski
Publisher:
Cengage
Trigonometry (MindTap Course List)
Trigonometry
ISBN:
9781337278461
Author:
Ron Larson
Publisher:
Cengage Learning

Functions and Change: A Modeling Approach to Coll…
Algebra
ISBN:
9781337111348
Author:
Bruce Crauder, Benny Evans, Alan Noell
Publisher:
Cengage Learning