The accompanying dataset provides data on the monthly usage of natural gas (in millions of cubic feet) for a certain region over two years. Implement the Holt-Winters multiplicative seasonalit model with no trend to find the forecast for periods 13-26, where x = 0.6 and y=0.9. Then find the MAD for periods 13-24. Click the icon to view the monthly use of natural gas data. Use the Holt-Winters multiplicative seasonality model with no trend to find the forecast for periods 13-18, periods 19-24, and then for periods 25 and 26. (Type integers or decimals rounded to two decimal places as needed.) Period Forecast 13 Natural Gas Usage 14 15 16 17 18 ☐☐☐☐☐☐ Month Jan Feb Mar Apr May Jun Jul Aug Sep Oct Nov Dec Jan Feb Mar Apr May Jun Jul Aug Sep Oct Nov Dec Period Gas Usage 1 2 3 4 5 6 7 1891012345678192012223 24 251 227 157 138 53 33 30 29 28 41 87 196 231 252 240 135 34 34 27 27 29 39 86 188 - X
The accompanying dataset provides data on the monthly usage of natural gas (in millions of cubic feet) for a certain region over two years. Implement the Holt-Winters multiplicative seasonalit model with no trend to find the forecast for periods 13-26, where x = 0.6 and y=0.9. Then find the MAD for periods 13-24. Click the icon to view the monthly use of natural gas data. Use the Holt-Winters multiplicative seasonality model with no trend to find the forecast for periods 13-18, periods 19-24, and then for periods 25 and 26. (Type integers or decimals rounded to two decimal places as needed.) Period Forecast 13 Natural Gas Usage 14 15 16 17 18 ☐☐☐☐☐☐ Month Jan Feb Mar Apr May Jun Jul Aug Sep Oct Nov Dec Jan Feb Mar Apr May Jun Jul Aug Sep Oct Nov Dec Period Gas Usage 1 2 3 4 5 6 7 1891012345678192012223 24 251 227 157 138 53 33 30 29 28 41 87 196 231 252 240 135 34 34 27 27 29 39 86 188 - X

Practical Management Science
6th Edition
ISBN:9781337406659
Author:WINSTON, Wayne L.
Publisher:WINSTON, Wayne L.
Chapter13: Regression And Forecasting Models
Section13.7: Exponential Smoothing Models
Problem 28P: The file P13_28.xlsx contains monthly retail sales of U.S. liquor stores. a. Is seasonality present...

Related questions
Question
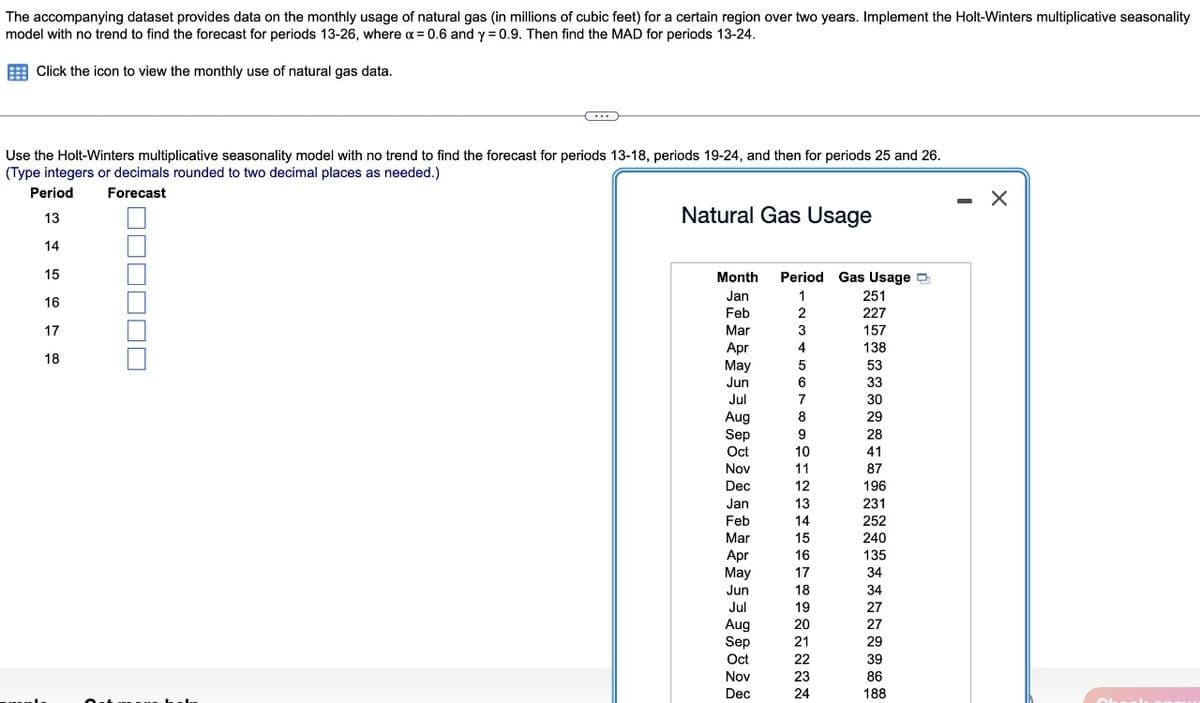
Transcribed Image Text:The accompanying dataset provides data on the monthly usage of natural gas (in millions of cubic feet) for a certain region over two years. Implement the Holt-Winters multiplicative seasonality
model with no trend to find the forecast for periods 13-26, where x = 0.6 and y=0.9. Then find the MAD for periods 13-24.
Click the icon to view the monthly use of natural gas data.
Use the Holt-Winters multiplicative seasonality model with no trend to find the forecast for periods 13-18, periods 19-24, and then for periods 25 and 26.
(Type integers or decimals rounded to two decimal places as needed.)
Period
Forecast
13
14
15
16
17
18
C...
☐☐☐☐☐☐
Natural Gas Usage
Month Period Gas Usage
1
2
3
4
Jan
Feb
Mar
Apr
May
Jun
Jul
Aug
Sep
Oct
Nov
Dec
Jan
Feb
Mar
Apr
May
Jun
Jul
Aug
Sep
Oct
Nov
Dec
5
6
TORINESTRANN
7
8
9
10
11
12
13
14
15
16
17
18
19
20
21
22
23
24
251
227
157
138
53
33
30
29
28
41
87
196
231
252
240
135
34
34
27
27
29
39
86
188
-
X
Expert Solution
This question has been solved!
Explore an expertly crafted, step-by-step solution for a thorough understanding of key concepts.

This is a popular solution!

Trending now
This is a popular solution!

Step by step
Solved in 5 steps with 10 images

Recommended textbooks for you
Practical Management Science
Operations Management
ISBN:
9781337406659
Author:
WINSTON, Wayne L.
Publisher:
Cengage,

Contemporary Marketing
Marketing
ISBN:
9780357033777
Author:
Louis E. Boone, David L. Kurtz
Publisher:
Cengage Learning

Marketing
Marketing
ISBN:
9780357033791
Author:
Pride, William M
Publisher:
South Western Educational Publishing
Practical Management Science
Operations Management
ISBN:
9781337406659
Author:
WINSTON, Wayne L.
Publisher:
Cengage,
Contemporary Marketing
Marketing
ISBN:
9780357033777
Author:
Louis E. Boone, David L. Kurtz
Publisher:
Cengage Learning
Marketing
Marketing
ISBN:
9780357033791
Author:
Pride, William M
Publisher:
South Western Educational Publishing