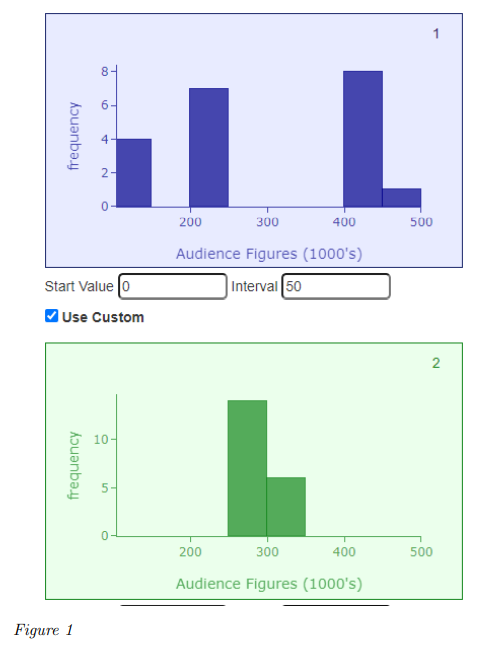
The advertising company creates histograms, shown in Figure 1, for the podcasts data, but forgets to label them. Which histogram represents the data for the podcast from radio station A? Explain your answer.
The advertising company creates histograms, shown in Figure 1, for the podcasts data, but forgets to label them. Which histogram represents the data for the podcast from radio station A? Explain your answer.

Holt Mcdougal Larson Pre-algebra: Student Edition 2012
1st Edition
ISBN:9780547587776
Author:HOLT MCDOUGAL
Publisher:HOLT MCDOUGAL
Chapter11: Data Analysis And Probability
Section11.5: Interpreting Data
Problem 1C

Related questions
Question
The advertising company creates histograms, shown in Figure 1, for
the podcasts data, but forgets to label them. Which histogram
represents the data for the podcast from radio station A? Explain
your answer.
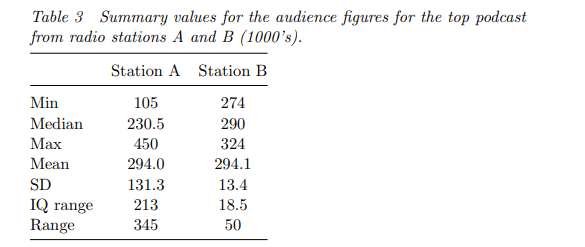
Transcribed Image Text:Table 3 Summary values for the audience figures for the top podcast
from radio stations A and B (1000's).
Station A Station B
Min
105
274
Median
230.5
290
Max
450
324
Mean
294.0
294.1
SD
131.3
13.4
IQ range
213
18.5
Range
345
50
Transcribed Image Text:frequency
frequency
8
2-
0
Start Value 0
✔ Use Custom
10-
Figure 1
10
in
1
IL
200
300
400
500
Audience Figures (1000's)
Interval 50
200
300
400
Audience Figures (1000's)
2
500
Expert Solution
This question has been solved!
Explore an expertly crafted, step-by-step solution for a thorough understanding of key concepts.

Step by step
Solved in 3 steps

Recommended textbooks for you
Holt Mcdougal Larson Pre-algebra: Student Edition…
Algebra
ISBN:
9780547587776
Author:
HOLT MCDOUGAL
Publisher:
HOLT MCDOUGAL

Glencoe Algebra 1, Student Edition, 9780079039897…
Algebra
ISBN:
9780079039897
Author:
Carter
Publisher:
McGraw Hill
Holt Mcdougal Larson Pre-algebra: Student Edition…
Algebra
ISBN:
9780547587776
Author:
HOLT MCDOUGAL
Publisher:
HOLT MCDOUGAL
Glencoe Algebra 1, Student Edition, 9780079039897…
Algebra
ISBN:
9780079039897
Author:
Carter
Publisher:
McGraw Hill