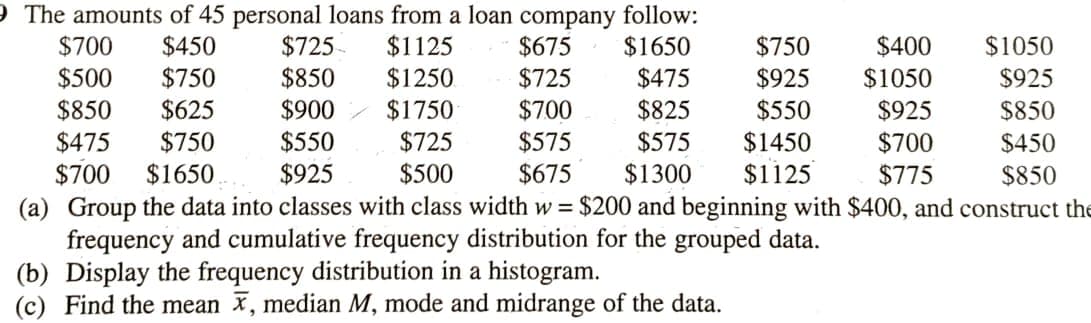
The amounts of 45 personal loans from a loan company follow: $700 $450 $725 $1125 $675 $1650 $750 $400 $1050 $750 $625 $750 $850 $900 $500 $1250 $725 $475 $925 $1050 $925 $1750 $725 $850 $700 $825 $550 $925 $850 $550 $925 $475 $575 $575 $1300 $1450 $700 $450 $500 $1125 $700 (a) Group the data into classes with class width w = $200 and beginning with $400, and construct the frequency and cumulative frequency distribution for the grouped data. (b) Display the frequency distribution in a histogram. (c) Find the mean x, median M, mode and midrange of the data. $1650 $675 $775 $850
The amounts of 45 personal loans from a loan company follow: $700 $450 $725 $1125 $675 $1650 $750 $400 $1050 $750 $625 $750 $850 $900 $500 $1250 $725 $475 $925 $1050 $925 $1750 $725 $850 $700 $825 $550 $925 $850 $550 $925 $475 $575 $575 $1300 $1450 $700 $450 $500 $1125 $700 (a) Group the data into classes with class width w = $200 and beginning with $400, and construct the frequency and cumulative frequency distribution for the grouped data. (b) Display the frequency distribution in a histogram. (c) Find the mean x, median M, mode and midrange of the data. $1650 $675 $775 $850

Functions and Change: A Modeling Approach to College Algebra (MindTap Course List)
6th Edition
ISBN:9781337111348
Author:Bruce Crauder, Benny Evans, Alan Noell
Publisher:Bruce Crauder, Benny Evans, Alan Noell
Chapter5: A Survey Of Other Common Functions
Section5.3: Modeling Data With Power Functions
Problem 6E: Urban Travel Times Population of cities and driving times are related, as shown in the accompanying...

Related questions
Question
Transcribed Image Text:9 The amounts of 45 personal loans from a loan company follow:
$725
$850
$900
$550
$925
$450
$750
$625
$750
$1650
$1125
$1050
$925
$700
$675
$1650
$750
$400
$1050
$475
$825
$500
$1250
$725
$925
$700
$575
$675
$850
$475
$700
(a) Group the data into classes with class width w = $200 and beginning with $400, and construct the
frequency and cumulative frequency distribution for the grouped data.
(b) Display the frequency distribution in a histogram.
(c) Find the mean x, median M, mode and midrange of the data.
$1750
$725
$550
$925
$850
$575
$1450
$700
$450
$500
$1300
$1125
$775
$850
Expert Solution
This question has been solved!
Explore an expertly crafted, step-by-step solution for a thorough understanding of key concepts.

This is a popular solution!

Trending now
This is a popular solution!

Step by step
Solved in 4 steps with 11 images

Recommended textbooks for you
Functions and Change: A Modeling Approach to Coll…
Algebra
ISBN:
9781337111348
Author:
Bruce Crauder, Benny Evans, Alan Noell
Publisher:
Cengage Learning
Functions and Change: A Modeling Approach to Coll…
Algebra
ISBN:
9781337111348
Author:
Bruce Crauder, Benny Evans, Alan Noell
Publisher:
Cengage Learning