The annual salary for one particular occupation is normally distributed, with a mean of about $126,000 and a standard deviation of about $18,000. Random samples of 30 are drawn from this population, and the mean of each sample is determined. Find the mean and standard deviation of the sampling distribution of these sample means. Then, sketch a graph of the sampling distribution. The mean is μ =, and the standard deviation is o =. (Round the nearest integer as needed. Do not include the $ symbol in your answers.)
The annual salary for one particular occupation is normally distributed, with a mean of about $126,000 and a standard deviation of about $18,000. Random samples of 30 are drawn from this population, and the mean of each sample is determined. Find the mean and standard deviation of the sampling distribution of these sample means. Then, sketch a graph of the sampling distribution. The mean is μ =, and the standard deviation is o =. (Round the nearest integer as needed. Do not include the $ symbol in your answers.)

Glencoe Algebra 1, Student Edition, 9780079039897, 0079039898, 2018
18th Edition
ISBN:9780079039897
Author:Carter
Publisher:Carter
Chapter10: Statistics
Section10.4: Distributions Of Data
Problem 19PFA

Related questions
Question
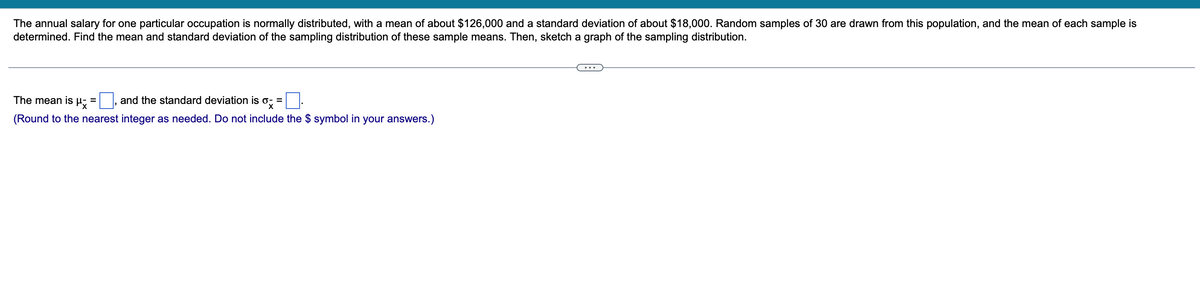
Transcribed Image Text:The annual salary for one particular occupation is normally distributed, with a mean of about $126,000 and a standard deviation of about $18,000. Random samples of 30 are drawn from this population, and the mean of each sample is
determined. Find the mean and standard deviation of the sampling distribution of these sample means. Then, sketch a graph of the sampling distribution.
The mean is
= and the standard deviation is ox=
(Round to the nearest integer as needed. Do not include the $ symbol in your answers.)
Expert Solution
This question has been solved!
Explore an expertly crafted, step-by-step solution for a thorough understanding of key concepts.

This is a popular solution!

Trending now
This is a popular solution!

Step by step
Solved in 2 steps

Recommended textbooks for you
Glencoe Algebra 1, Student Edition, 9780079039897…
Algebra
ISBN:
9780079039897
Author:
Carter
Publisher:
McGraw Hill
Glencoe Algebra 1, Student Edition, 9780079039897…
Algebra
ISBN:
9780079039897
Author:
Carter
Publisher:
McGraw Hill