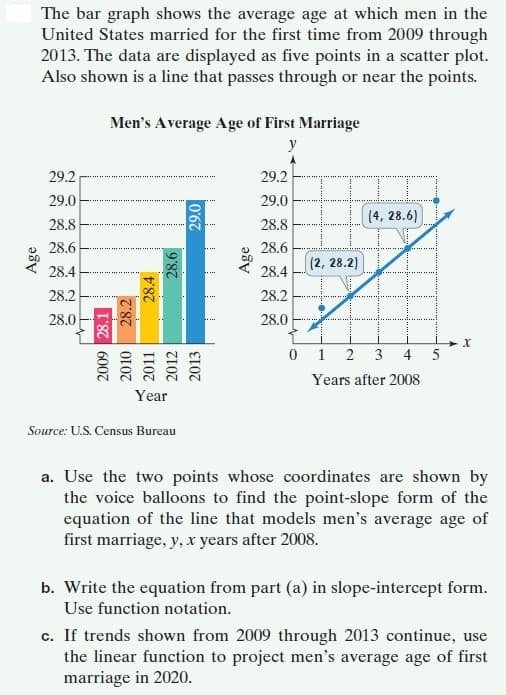
The bar graph shows the average age at which men in the United States married for the first time from 2009 through 2013. The data are displayed as five points in a scatter plot. Also shown is a line that passes through or near the points. Men's Average Age of First Marriage y 29.2 29.2 29.0 29.0 (4, 28.6) 28.8 28.8 y....... 28.6 28.6 (2, 28.2) 28.4 28.4 ***. 28.2 28.2 28.0 28.0 0 1 2 3 4 5 Years after 2008 Year Source: U.S. Census Bureau a. Use the two points whose coordinates are shown by the voice balloons to find the point-slope form of the equation of the line that models men's average age of first marriage, y, x years after 2008. b. Write the equation from part (a) in slope-intercept form. Use function notation. c. If trends shown from 2009 through 2013 continue, use the linear function to project men's average age of first marriage in 2020. Age 2009 28.1 28.2 2010 2011 28.4 2012 28.6 2013 0'67 Age
The bar graph shows the average age at which men in the United States married for the first time from 2009 through 2013. The data are displayed as five points in a scatter plot. Also shown is a line that passes through or near the points. Men's Average Age of First Marriage y 29.2 29.2 29.0 29.0 (4, 28.6) 28.8 28.8 y....... 28.6 28.6 (2, 28.2) 28.4 28.4 ***. 28.2 28.2 28.0 28.0 0 1 2 3 4 5 Years after 2008 Year Source: U.S. Census Bureau a. Use the two points whose coordinates are shown by the voice balloons to find the point-slope form of the equation of the line that models men's average age of first marriage, y, x years after 2008. b. Write the equation from part (a) in slope-intercept form. Use function notation. c. If trends shown from 2009 through 2013 continue, use the linear function to project men's average age of first marriage in 2020. Age 2009 28.1 28.2 2010 2011 28.4 2012 28.6 2013 0'67 Age

Glencoe Algebra 1, Student Edition, 9780079039897, 0079039898, 2018
18th Edition
ISBN:9780079039897
Author:Carter
Publisher:Carter
Chapter10: Statistics
Section10.6: Summarizing Categorical Data
Problem 23PPS

Related questions
Question
Transcribed Image Text:The bar graph shows the average age at which men in the
United States married for the first time from 2009 through
2013. The data are displayed as five points in a scatter plot.
Also shown is a line that passes through or near the points.
Men's Average Age of First Marriage
y
29.2
29.2
29.0
29.0
(4, 28.6)
28.8
28.8
y.......
28.6
28.6
(2, 28.2)
28.4
28.4
***.
28.2
28.2
28.0
28.0
0 1
2 3
4
5
Years after 2008
Year
Source: U.S. Census Bureau
a. Use the two points whose coordinates are shown by
the voice balloons to find the point-slope form of the
equation of the line that models men's average age of
first marriage, y, x years after 2008.
b. Write the equation from part (a) in slope-intercept form.
Use function notation.
c. If trends shown from 2009 through 2013 continue, use
the linear function to project men's average age of first
marriage in 2020.
Age
2009 28.1
28.2
2010
2011
28.4
2012
28.6
2013
0'67
Age
Expert Solution
This question has been solved!
Explore an expertly crafted, step-by-step solution for a thorough understanding of key concepts.

This is a popular solution!

Trending now
This is a popular solution!

Step by step
Solved in 3 steps

Recommended textbooks for you
Glencoe Algebra 1, Student Edition, 9780079039897…
Algebra
ISBN:
9780079039897
Author:
Carter
Publisher:
McGraw Hill

Holt Mcdougal Larson Pre-algebra: Student Edition…
Algebra
ISBN:
9780547587776
Author:
HOLT MCDOUGAL
Publisher:
HOLT MCDOUGAL

Big Ideas Math A Bridge To Success Algebra 1: Stu…
Algebra
ISBN:
9781680331141
Author:
HOUGHTON MIFFLIN HARCOURT
Publisher:
Houghton Mifflin Harcourt
Glencoe Algebra 1, Student Edition, 9780079039897…
Algebra
ISBN:
9780079039897
Author:
Carter
Publisher:
McGraw Hill
Holt Mcdougal Larson Pre-algebra: Student Edition…
Algebra
ISBN:
9780547587776
Author:
HOLT MCDOUGAL
Publisher:
HOLT MCDOUGAL
Big Ideas Math A Bridge To Success Algebra 1: Stu…
Algebra
ISBN:
9781680331141
Author:
HOUGHTON MIFFLIN HARCOURT
Publisher:
Houghton Mifflin Harcourt