The boxplot below shows the distribution of waiting time in minutes for 80 customers at a coffee shop from when they enter to when they get served. Estimate the probability that the two customers chosen at random will wait 8.3 minutes or longer each for their coffee.
The boxplot below shows the distribution of waiting time in minutes for 80 customers at a coffee shop from when they enter to when they get served. Estimate the probability that the two customers chosen at random will wait 8.3 minutes or longer each for their coffee.

Chapter8: Sequences, Series,and Probability
Section8.7: Probability
Problem 4ECP: Show that the probability of drawing a club at random from a standard deck of 52 playing cards is...

Related questions
Question
25
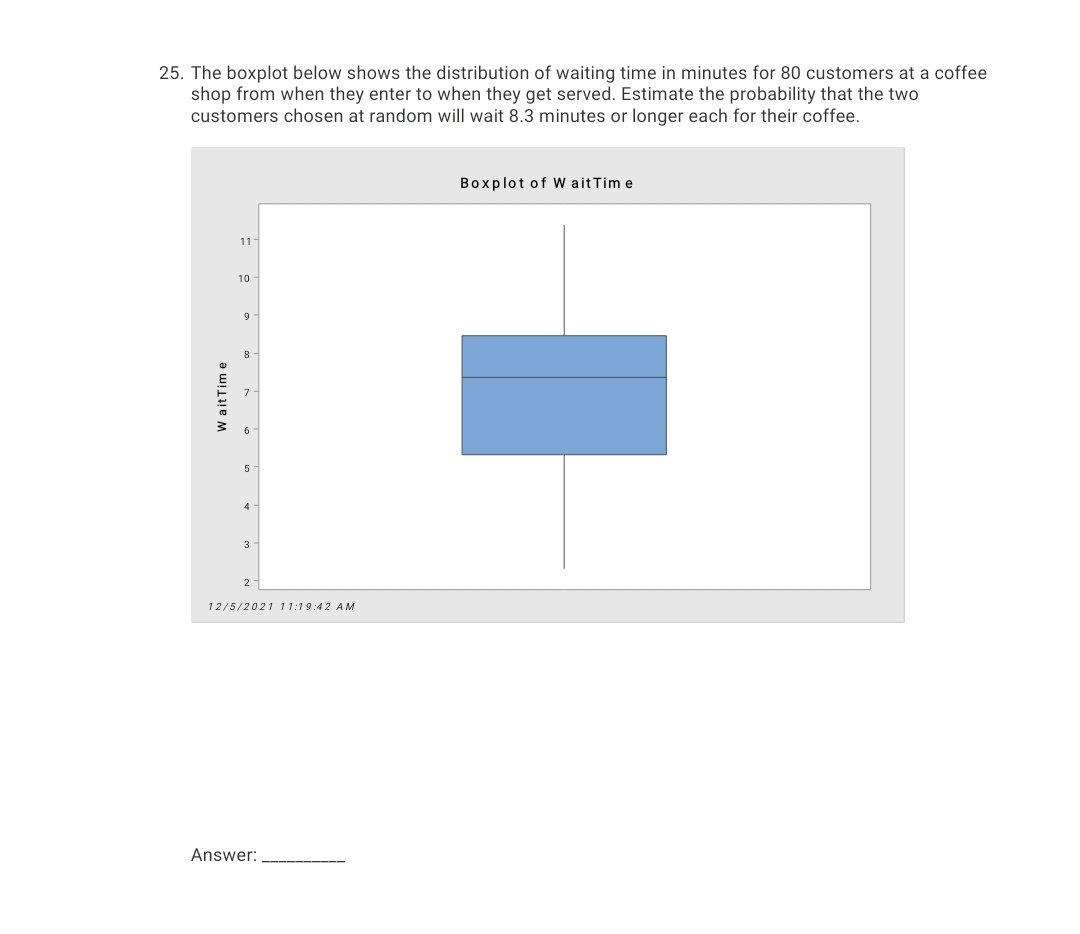
Transcribed Image Text:25. The boxplot below shows the distribution of waiting time in minutes for 80 customers at a coffee
shop from when they enter to when they get served. Estimate the probability that the two
customers chosen at random will wait 8.3 minutes or longer each for their coffee.
Boxplot of W ait Tim e
11
10
9
8
6
4
3
12/5/2021 11:19:42 AM
Answer:
W aitTim e
Expert Solution
This question has been solved!
Explore an expertly crafted, step-by-step solution for a thorough understanding of key concepts.

This is a popular solution!

Trending now
This is a popular solution!

Step by step
Solved in 2 steps with 1 images

Recommended textbooks for you

Algebra & Trigonometry with Analytic Geometry
Algebra
ISBN:
9781133382119
Author:
Swokowski
Publisher:
Cengage
Algebra & Trigonometry with Analytic Geometry
Algebra
ISBN:
9781133382119
Author:
Swokowski
Publisher:
Cengage