The capacities at which U.S. nuclear power plants are working are shown in table for various years. Year Percent 1975 56 1980 59 1985 58 1990 70 1995 76 2000 88 2004 89 et f(t) be the capacity (in percent) at which U.S. nuclear power plants are working at t years since 1970. model of the situation is f(t) = 0.027t² +0.216t+53.296. se a graphing calculator to draw the graph of the model and, in the same viewing window, the attergram of the data. Does the model fit the data well? O The function is a good model for the data. O The function is not a good model for the data mate at what capacity U. S. nuclear power plants were working in 2009. % Round to the nearest whole percent. dict when U. S. nuclear power plants will be working at full (100%) capacity. Enter the year this occurs. the ru.…..
The capacities at which U.S. nuclear power plants are working are shown in table for various years. Year Percent 1975 56 1980 59 1985 58 1990 70 1995 76 2000 88 2004 89 et f(t) be the capacity (in percent) at which U.S. nuclear power plants are working at t years since 1970. model of the situation is f(t) = 0.027t² +0.216t+53.296. se a graphing calculator to draw the graph of the model and, in the same viewing window, the attergram of the data. Does the model fit the data well? O The function is a good model for the data. O The function is not a good model for the data mate at what capacity U. S. nuclear power plants were working in 2009. % Round to the nearest whole percent. dict when U. S. nuclear power plants will be working at full (100%) capacity. Enter the year this occurs. the ru.…..

Algebra & Trigonometry with Analytic Geometry
13th Edition
ISBN:9781133382119
Author:Swokowski
Publisher:Swokowski
Chapter4: Polynomial And Rational Functions
Section4.3: Zeros Of Polynomials
Problem 63E

Related questions
Question
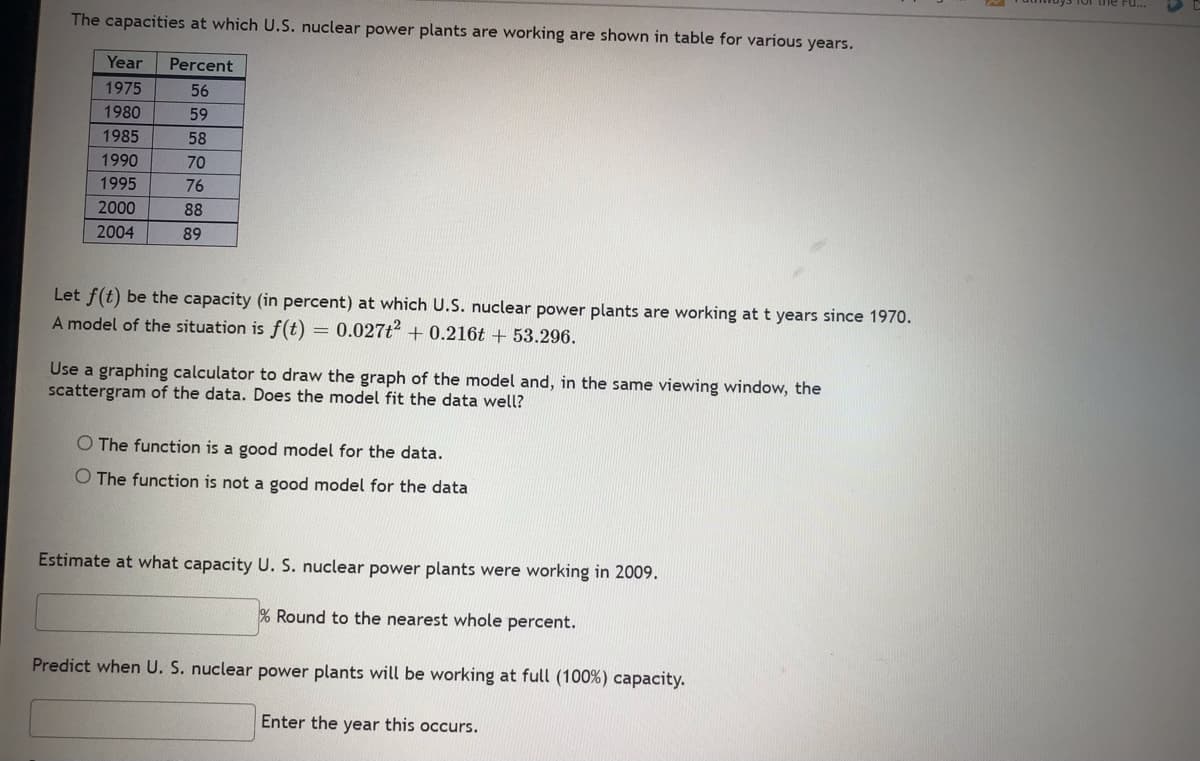
Transcribed Image Text:The capacities at which U.S. nuclear power plants are working are shown in table for various years.
Year Percent
1975
56
1980
59
1985
58
1990
70
1995
76
2000
88
2004
89
Let f(t) be the capacity (in percent) at which U.S. nuclear power plants are working at t years since 1970.
A model of the situation is f(t) = 0.027t2 +0.216t+53.296.
Use a graphing calculator to draw the graph of the model and, in the same viewing window, the
scattergram of the data. Does the model fit the data well?
O The function is a good model for the data.
O The function is not a good model for the data
Estimate at what capacity U. S. nuclear power plants were working in 2009.
% Round to the nearest whole percent.
Predict when U. S. nuclear power plants will be working at full (100%) capacity.
Enter the year this occurs.
Expert Solution
This question has been solved!
Explore an expertly crafted, step-by-step solution for a thorough understanding of key concepts.

Step by step
Solved in 4 steps with 4 images

Recommended textbooks for you
Algebra & Trigonometry with Analytic Geometry
Algebra
ISBN:
9781133382119
Author:
Swokowski
Publisher:
Cengage

Glencoe Algebra 1, Student Edition, 9780079039897…
Algebra
ISBN:
9780079039897
Author:
Carter
Publisher:
McGraw Hill

Algebra and Trigonometry (MindTap Course List)
Algebra
ISBN:
9781305071742
Author:
James Stewart, Lothar Redlin, Saleem Watson
Publisher:
Cengage Learning
Algebra & Trigonometry with Analytic Geometry
Algebra
ISBN:
9781133382119
Author:
Swokowski
Publisher:
Cengage
Glencoe Algebra 1, Student Edition, 9780079039897…
Algebra
ISBN:
9780079039897
Author:
Carter
Publisher:
McGraw Hill
Algebra and Trigonometry (MindTap Course List)
Algebra
ISBN:
9781305071742
Author:
James Stewart, Lothar Redlin, Saleem Watson
Publisher:
Cengage Learning