a. Use the empirical rule to describe the distribution of heights for males. Approximately 68% of the observations fall within the interval (.). (Type a whole number.)
a. Use the empirical rule to describe the distribution of heights for males. Approximately 68% of the observations fall within the interval (.). (Type a whole number.)

Glencoe Algebra 1, Student Edition, 9780079039897, 0079039898, 2018
18th Edition
ISBN:9780079039897
Author:Carter
Publisher:Carter
Chapter10: Statistics
Section10.4: Distributions Of Data
Problem 19PFA

Related questions
Question
b.
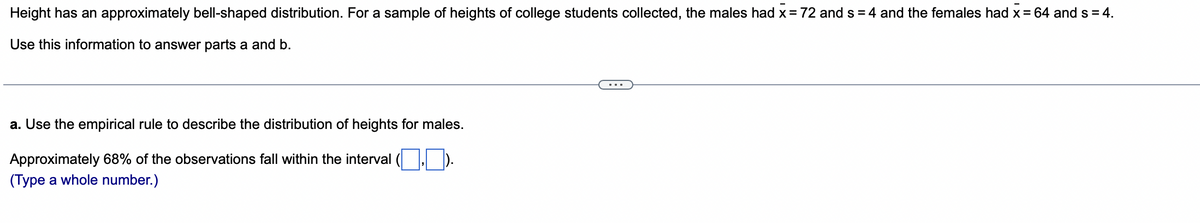
Transcribed Image Text:Height has an approximately bell-shaped distribution. For a sample of heights of college students collected, the males had x = 72 and s=4 and the females had x = 64 and s = 4.
Use this information to answer parts a and b.
a. Use the empirical rule to describe the distribution of heights for males.
Approximately 68% of the observations fall within the interval (.).
(Type a whole number.)
Expert Solution
This question has been solved!
Explore an expertly crafted, step-by-step solution for a thorough understanding of key concepts.

This is a popular solution!

Trending now
This is a popular solution!

Step by step
Solved in 2 steps with 2 images

Follow-up Questions
Read through expert solutions to related follow-up questions below.
Follow-up Question

Transcribed Image Text:The carbon dioxide emissions of EU nations had a mean of 7.9 and standard deviation of 3.6.
a. Belgium's observation was 10.0. Find its z-score and interpret.
b. Romania's observation was 3.9. Find its z-score and interpret.
c. Slovak Republic's observation was 6.7. Find its z-score and interpret.
a. The z-score is 0.58. This indicates that the observation of 10.0 is a distance of 0.58 standard deviation(s) above the mean.
(Round to two decimal places as needed.)
b. The z-score is . This indicates that the observation of 3.9 is a distance of
(Round to two decimal places as needed.)
the
Solution
Recommended textbooks for you
Glencoe Algebra 1, Student Edition, 9780079039897…
Algebra
ISBN:
9780079039897
Author:
Carter
Publisher:
McGraw Hill
Glencoe Algebra 1, Student Edition, 9780079039897…
Algebra
ISBN:
9780079039897
Author:
Carter
Publisher:
McGraw Hill