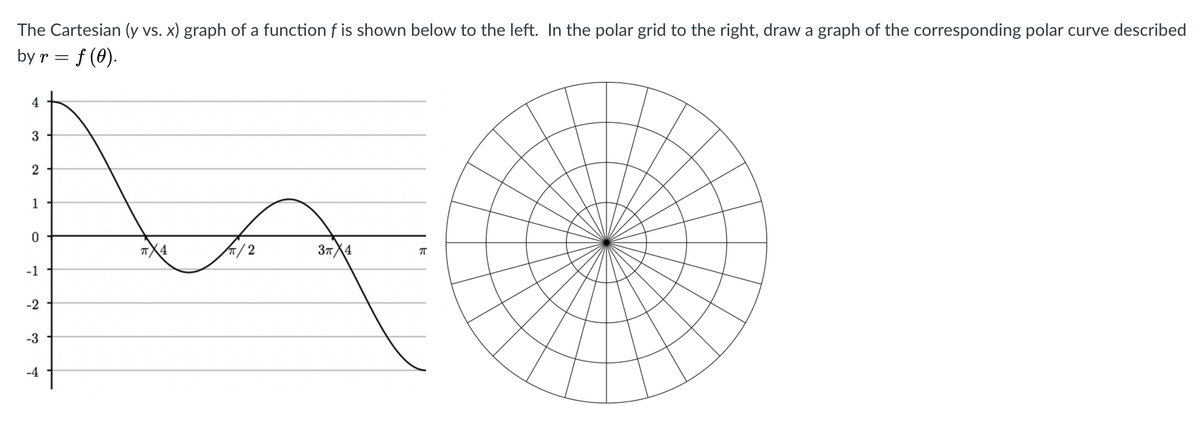
The Cartesian (y vs. x) graph of a function f is shown below to the left. In the polar grid to the right, draw a graph of the corresponding polar curve described by r = f (0). 4 3 1 /2 37X4 -1 -2 -3 -4
The Cartesian (y vs. x) graph of a function f is shown below to the left. In the polar grid to the right, draw a graph of the corresponding polar curve described by r = f (0). 4 3 1 /2 37X4 -1 -2 -3 -4

Algebra & Trigonometry with Analytic Geometry
13th Edition
ISBN:9781133382119
Author:Swokowski
Publisher:Swokowski
Chapter11: Topics From Analytic Geometry
Section11.5: Polar Coordinates
Problem 88E

Related questions
Topic Video
Question
Transcribed Image Text:The Cartesian (y vs. x) graph of a function f is shown below to the left. In the polar grid to the right, draw a graph of the corresponding polar curve described
by r = f (0).
4
1
TX4
2.
37X4
-1
-2
-3
-4
Expert Solution
This question has been solved!
Explore an expertly crafted, step-by-step solution for a thorough understanding of key concepts.

Step by step
Solved in 2 steps with 2 images

Knowledge Booster


Learn more about
Need a deep-dive on the concept behind this application? Look no further. Learn more about this topic, advanced-math and related others by exploring similar questions and additional content below.Recommended textbooks for you
Algebra & Trigonometry with Analytic Geometry
Algebra
ISBN:
9781133382119
Author:
Swokowski
Publisher:
Cengage
Algebra & Trigonometry with Analytic Geometry
Algebra
ISBN:
9781133382119
Author:
Swokowski
Publisher:
Cengage