The cat population in a small town can be estimated with a logistic function. Data from a logistic model for the cat population are given in the table below, where Prepresents the cat population, and tis measured in years. In this data, t=0 corresponds to the year 2000. P() 24 55 103 150 What is the average rate of change of the cat population from 2001 to 2004? O The cat population O The cat population is increasing at a rate of 42 cats per year during this time. O The cat population is decreasing at a rate of 48 cats per year during this time. O The cat population is increasing at a rate of 48 cats per year during this time. decreasing at a rate of 42 cats per year during this time.
The cat population in a small town can be estimated with a logistic function. Data from a logistic model for the cat population are given in the table below, where Prepresents the cat population, and tis measured in years. In this data, t=0 corresponds to the year 2000. P() 24 55 103 150 What is the average rate of change of the cat population from 2001 to 2004? O The cat population O The cat population is increasing at a rate of 42 cats per year during this time. O The cat population is decreasing at a rate of 48 cats per year during this time. O The cat population is increasing at a rate of 48 cats per year during this time. decreasing at a rate of 42 cats per year during this time.

Functions and Change: A Modeling Approach to College Algebra (MindTap Course List)
6th Edition
ISBN:9781337111348
Author:Bruce Crauder, Benny Evans, Alan Noell
Publisher:Bruce Crauder, Benny Evans, Alan Noell
Chapter5: A Survey Of Other Common Functions
Section5.1: Logistic Functions
Problem 21E: Eastern Pacific Yellowfin Tuna Studies to fit a logistic model to the Eastern Pacific yellowfin tuna...

Related questions
Question
44
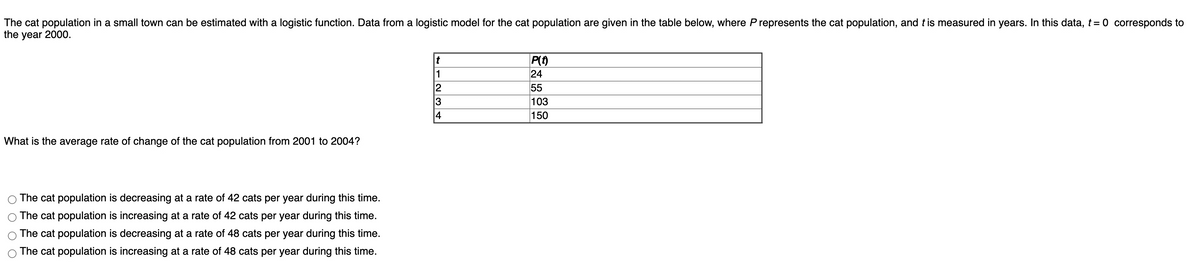
Transcribed Image Text:The cat population in a small town can be estimated with a logistic function. Data from a logistic model for the cat population are given in the table below, where P represents the cat population, and t is measured in years. In this data, t= 0 corresponds to
the year 2000.
P(t)
24
55
103
150
t
1
4
What is the average rate of change of the cat population from 2001 to 2004?
The cat population is decreasing at a rate of 42 cats per year during this time.
The cat population is increasing at a rate of 42 cats per year during this time.
The cat population is decreasing at a rate of 48 cats per year during this time.
The cat population is increasing at a rate of 48 cats per year during this time.
Expert Solution
This question has been solved!
Explore an expertly crafted, step-by-step solution for a thorough understanding of key concepts.

This is a popular solution!

Trending now
This is a popular solution!

Step by step
Solved in 2 steps with 1 images

Recommended textbooks for you
Functions and Change: A Modeling Approach to Coll…
Algebra
ISBN:
9781337111348
Author:
Bruce Crauder, Benny Evans, Alan Noell
Publisher:
Cengage Learning

College Algebra
Algebra
ISBN:
9781305115545
Author:
James Stewart, Lothar Redlin, Saleem Watson
Publisher:
Cengage Learning

Algebra & Trigonometry with Analytic Geometry
Algebra
ISBN:
9781133382119
Author:
Swokowski
Publisher:
Cengage
Functions and Change: A Modeling Approach to Coll…
Algebra
ISBN:
9781337111348
Author:
Bruce Crauder, Benny Evans, Alan Noell
Publisher:
Cengage Learning
College Algebra
Algebra
ISBN:
9781305115545
Author:
James Stewart, Lothar Redlin, Saleem Watson
Publisher:
Cengage Learning
Algebra & Trigonometry with Analytic Geometry
Algebra
ISBN:
9781133382119
Author:
Swokowski
Publisher:
Cengage


Trigonometry (MindTap Course List)
Trigonometry
ISBN:
9781337278461
Author:
Ron Larson
Publisher:
Cengage Learning
