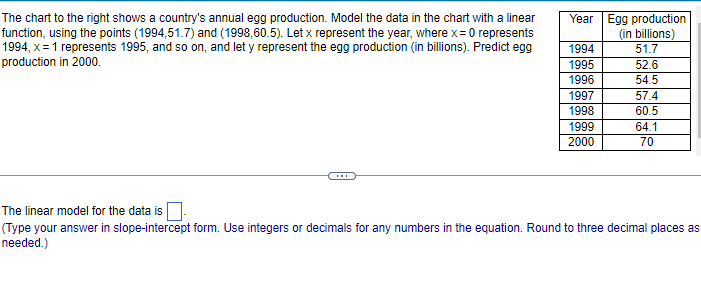
The chart to the right shows a country's annual egg production. Model the data in the chart with a linear function, using the points (1994,51.7) and (1998,60.5). Let x represent the year, where x = 0 represents 1994, x = 1 represents 1995, and so on, and let y represent the egg production (in billions). Predict egg production in 2000. Year Egg production (in billions) 51.7 52.6 54.5 1994 1995 1996 1997 1998 1999 2000 57.4 60.5 64.1 70 The linear model for the data is. (Type your answer in slope-intercept form. Use integers or decimals for any numbers in the equation. Round to three decimal places as needed.)
The chart to the right shows a country's annual egg production. Model the data in the chart with a linear function, using the points (1994,51.7) and (1998,60.5). Let x represent the year, where x = 0 represents 1994, x = 1 represents 1995, and so on, and let y represent the egg production (in billions). Predict egg production in 2000. Year Egg production (in billions) 51.7 52.6 54.5 1994 1995 1996 1997 1998 1999 2000 57.4 60.5 64.1 70 The linear model for the data is. (Type your answer in slope-intercept form. Use integers or decimals for any numbers in the equation. Round to three decimal places as needed.)

Chapter1: Equations, Inequalities, And Mathematical Modeling
Section1.2: Linear Equations In One Variable
Problem 6ECP: The number y (in thousands) of male participants in high school lacrosse in the United States from...

Related questions
Question
1.4.9
Transcribed Image Text:The chart to the right shows a country's annual egg production. Model the data in the chart with a linear
function, using the points (1994,51.7) and (1998,60.5). Let x represent the year, where x = 0 represents
1994, x = 1 represents 1995, and so on, and let y represent the egg production (in billions). Predict egg
production in 2000.
Year Egg production
(in billions)
51.7
1994
1995
1996
1997
1998
1999
2000
52.6
54.5
57.4
60.5
64.1
70
The linear model for the data is
(Type your answer in slope-intercept form. Use integers or decimals for any numbers in the equation. Round to three decimal places as
needed.)
Expert Solution
This question has been solved!
Explore an expertly crafted, step-by-step solution for a thorough understanding of key concepts.

Step by step
Solved in 2 steps

Recommended textbooks for you

Big Ideas Math A Bridge To Success Algebra 1: Stu…
Algebra
ISBN:
9781680331141
Author:
HOUGHTON MIFFLIN HARCOURT
Publisher:
Houghton Mifflin Harcourt

Algebra & Trigonometry with Analytic Geometry
Algebra
ISBN:
9781133382119
Author:
Swokowski
Publisher:
Cengage
Big Ideas Math A Bridge To Success Algebra 1: Stu…
Algebra
ISBN:
9781680331141
Author:
HOUGHTON MIFFLIN HARCOURT
Publisher:
Houghton Mifflin Harcourt
Algebra & Trigonometry with Analytic Geometry
Algebra
ISBN:
9781133382119
Author:
Swokowski
Publisher:
Cengage


Elementary Linear Algebra (MindTap Course List)
Algebra
ISBN:
9781305658004
Author:
Ron Larson
Publisher:
Cengage Learning

Holt Mcdougal Larson Pre-algebra: Student Edition…
Algebra
ISBN:
9780547587776
Author:
HOLT MCDOUGAL
Publisher:
HOLT MCDOUGAL