The comparative financial statements of Marshall Inc. are as follows. The market price of Marshall common stock was $82.60 on December 31, 20Y2 Marshall Inc. Comparative Retained Earnings Statement For the Years Ended December 31, 20Y2 and 20Y1 20Y2 20Y1 $3,704,000 $3,264,000 $ 600,000 $ 550,000 Retained earnings, January 1 Net income Dividends: On preferred stock On common stock (10,000) (10,000) (100,000) $ 490,000 (100,000) Increase in retained earnings $ 440,000 Retained earnings, December 31 $4,194,000 $3,704,000 MarshalL Inc.
The comparative financial statements of Marshall Inc. are as follows. The market price of Marshall common stock was $82.60 on December 31, 20Y2 Marshall Inc. Comparative Retained Earnings Statement For the Years Ended December 31, 20Y2 and 20Y1 20Y2 20Y1 $3,704,000 $3,264,000 $ 600,000 $ 550,000 Retained earnings, January 1 Net income Dividends: On preferred stock On common stock (10,000) (10,000) (100,000) $ 490,000 (100,000) Increase in retained earnings $ 440,000 Retained earnings, December 31 $4,194,000 $3,704,000 MarshalL Inc.

Financial Accounting
15th Edition
ISBN:9781337272124
Author:Carl Warren, James M. Reeve, Jonathan Duchac
Publisher:Carl Warren, James M. Reeve, Jonathan Duchac
Chapter17: Financial Statement Analysis
Section: Chapter Questions
Problem 4PA: Measures of liquidity, solvency, and profitability The comparative financial statements of Marshall...

Related questions
Question
Transcribed Image Text:Measures of liquidity, solvency, and profitability
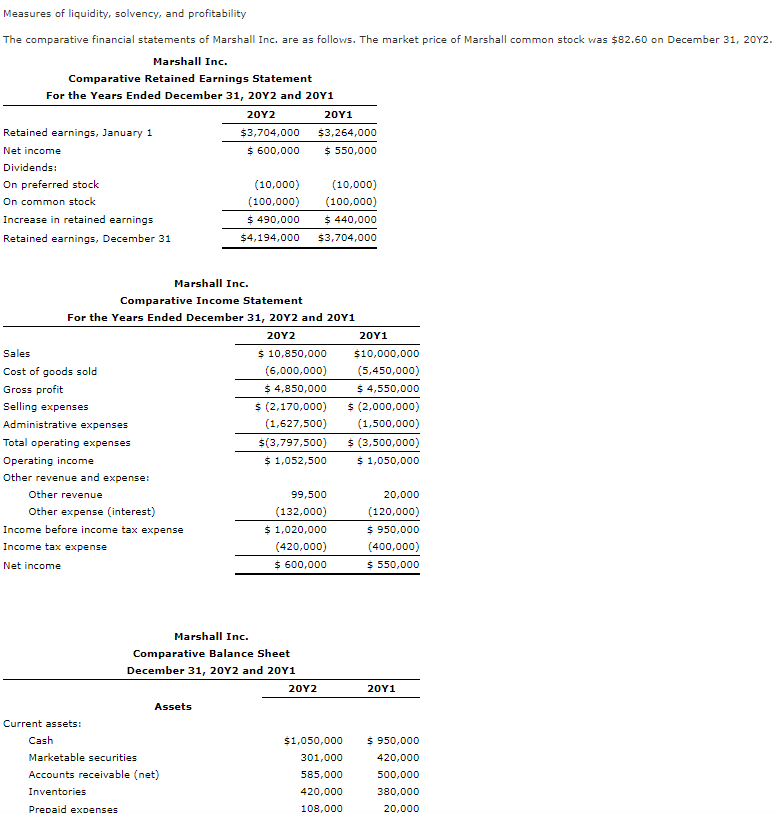
The comparative financial statements of Marshall Inc. are as follows. The market price of Marshall common stock was $82.60 on December 31, 20Y2.
Marshall Inc.
Comparative Retained Earnings Statement
For the Years Ended December 31, 20Y2 and 20Y1
20Υ2
20Υ1
Retained earnings, January 1
$3,704,000
$3,264,000
Net income
$ 600,000
$ 550,000
Dividends:
On preferred stock
(10,000)
(10,000)
On common stock
(100,000)
(100,000)
Increase in retained earnings
$ 490,000
$ 440,000
Retained earnings, December 31
$4,194,000
$3,704,000
Marshall Inc.
Comparative Income Statement
For the Years Ended December 31, 20Y2 and 20Y1
20Y2
20Υ1
Sales
$ 10,850,000
$10,000,000
Cost of goods sold
(6,000,000)
(5,450,000)
$ 4,850,000
$ (2,170,000)
Gross profit
$ 4,550,000
Selling expenses
$ (2,000,000)
Administrative expenses
(1,627,500)
(1,500,000)
Total operating expenses
$(3,797,500)
$ (3,500,000)
Operating income
$ 1,052,500
$ 1,050,000
Other revenue and expense:
Other revenue
99,500
20,000
Other expense (interest)
(132,000)
(120,000)
Income before income tax expense
$ 1,020,000
$ 950,000
Income tax expense
(420,000)
(400,000)
Net income
$ 600,000
$ 550,000
Marshall Inc.
Comparative Balance Sheet
December 31, 20Y2 and 20Y1
20Y2
20Υ1
Assets
Current assets:
Cash
$1,050,000
$ 950,000
Marketable securities
301,000
420,000
Accounts receivable (net)
585,000
500,000
Inventories
420,000
380,000
Prepaid expenses
108,000
20,000
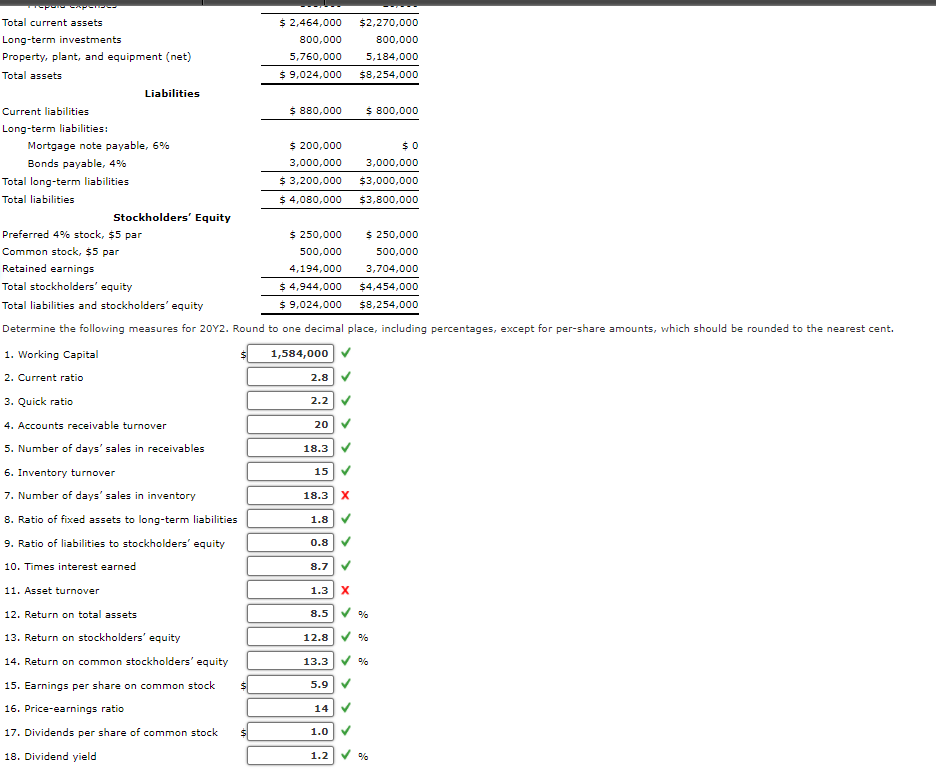
Transcribed Image Text:Total current assets
$ 2,464,000
$2,270,000
Long-term investments
800,000
800,000
Property, plant, and equipment (net)
5,760,000
5,184,000
Total assets
$ 9,024,000
$8,254,000
Liabilities
Current liabilities
$ 880,000
$ 800,000
Long-term liabilities:
Mortgage note payable, 6%
$ 200,000
$0
Bonds payable, 4%
3,000,000
3,000,000
Total long-term liabilities
$ 3,200,000
$3,000,000
Total liabilities
$ 4,080,000
$3,800,000
Stockholders' Equity
Preferred 4% stock, $5 par
$ 250,000
$ 250,000
Common stock, $5 par
500,000
500,000
Retained earnings
4,194,000
3,704,000
Total stockholders' equity
$ 4,944,000
$4,454,000
Total liabilities and stockholders' equity
$ 9,024,000
$8,254,000
Determine the following measures for 20Y2. Round to one decimal place, including percentages, except for per-share amounts, which should be rounded to the nearest cent.
1. Working Capital
1,584,000
2. Current ratio
2.8
3. Quick ratio
2.2
4. Accounts receivable turnover
20
5. Number of days' sales in receivables
18.3
6. Inventory turnover
15
7. Number of days' sales in inventory
18.3 X
8. Ratio of fixed assets to long-term liabilities
1.8
9. Ratio of liabilities to stockholders' equity
0.8
10. Times interest earned
8.7
11. Asset turnover
1.3 X
12. Return on total assets
8.5
13. Return on stockholders' equity
12.8
14. Return on common stockholders' equity
13.3 V %
15. Earnings per share on common stock
5.9
16. Price-earnings ratio
14
17. Dividends per share of common stock
1.0
18. Dividend yield
1.2
Expert Solution
This question has been solved!
Explore an expertly crafted, step-by-step solution for a thorough understanding of key concepts.

This is a popular solution!

Trending now
This is a popular solution!

Step by step
Solved in 2 steps

Recommended textbooks for you
Financial Accounting
Accounting
ISBN:
9781337272124
Author:
Carl Warren, James M. Reeve, Jonathan Duchac
Publisher:
Cengage Learning

Managerial Accounting
Accounting
ISBN:
9781337912020
Author:
Carl Warren, Ph.d. Cma William B. Tayler
Publisher:
South-Western College Pub

Financial And Managerial Accounting
Accounting
ISBN:
9781337902663
Author:
WARREN, Carl S.
Publisher:
Cengage Learning,
Financial Accounting
Accounting
ISBN:
9781337272124
Author:
Carl Warren, James M. Reeve, Jonathan Duchac
Publisher:
Cengage Learning
Managerial Accounting
Accounting
ISBN:
9781337912020
Author:
Carl Warren, Ph.d. Cma William B. Tayler
Publisher:
South-Western College Pub
Financial And Managerial Accounting
Accounting
ISBN:
9781337902663
Author:
WARREN, Carl S.
Publisher:
Cengage Learning,

Survey of Accounting (Accounting I)
Accounting
ISBN:
9781305961883
Author:
Carl Warren
Publisher:
Cengage Learning

Managerial Accounting: The Cornerstone of Busines…
Accounting
ISBN:
9781337115773
Author:
Maryanne M. Mowen, Don R. Hansen, Dan L. Heitger
Publisher:
Cengage Learning

Financial Accounting: The Impact on Decision Make…
Accounting
ISBN:
9781305654174
Author:
Gary A. Porter, Curtis L. Norton
Publisher:
Cengage Learning