The concentration C of a chemical in the bloodstream t hours after injection Into muscle tissues is glven by the following. 8t C(t) = 27 + t (a) Complete the table and use It to approximate the time when the concentration is greatest. (Round your answers to three decimal places.) 0.5 1.5 2 2.5 hr (b) Use a graphing utility to graph the concentration function and use the graph to approximate the time when the concentration is the greatest. 0.4 0.4 03 03 02 02 0.1 0.1 0.5 2 2.5 0.5 1 2.5 3 1.4 1.4 1.3 1.3 1.2 1.2 1.1 1.1 0.5 1 1.5 2 2.5 0.5 1 1.5 2 2.5 hr (c) Use calculus to determine analytically the time when the concentration is greatest. t = hr
The concentration C of a chemical in the bloodstream t hours after injection Into muscle tissues is glven by the following. 8t C(t) = 27 + t (a) Complete the table and use It to approximate the time when the concentration is greatest. (Round your answers to three decimal places.) 0.5 1.5 2 2.5 hr (b) Use a graphing utility to graph the concentration function and use the graph to approximate the time when the concentration is the greatest. 0.4 0.4 03 03 02 02 0.1 0.1 0.5 2 2.5 0.5 1 2.5 3 1.4 1.4 1.3 1.3 1.2 1.2 1.1 1.1 0.5 1 1.5 2 2.5 0.5 1 1.5 2 2.5 hr (c) Use calculus to determine analytically the time when the concentration is greatest. t = hr

College Algebra
7th Edition
ISBN:9781305115545
Author:James Stewart, Lothar Redlin, Saleem Watson
Publisher:James Stewart, Lothar Redlin, Saleem Watson
Chapter3: Polynomial And Rational Functions
Section3.1: Quadratic Functions And Models
Problem 56E: When a certain drug is taken orally, the concentration of the drug in the patient's bloodstream...

Related questions
Question
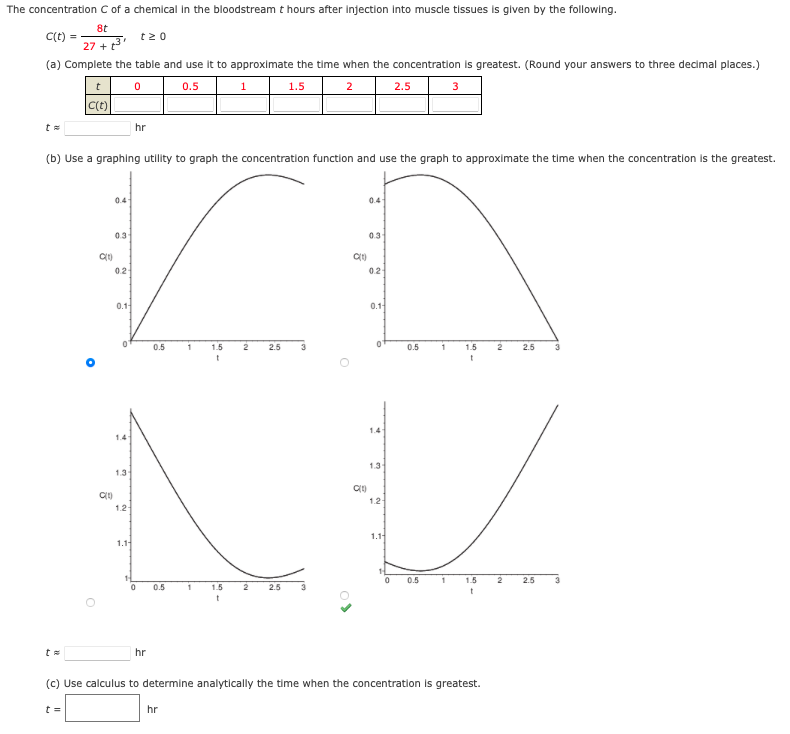
Transcribed Image Text:The concentration C of a chemical in the bloodstream t hours after Injection Into muscle tissues is glven by the following.
8t
C(t) =
27 + t
(a) Complete the table and use it to approximate the time when the concentration is greatest. (Round your answers to three decimal places.)
0.5
1
1.5
2
2.5
3
hr
(b) Use a graphing utility to graph the concentration function and use the graph to approximate the time when the concentration is the greatest.
0.3
0.3
02
02
0.1
0.1
0.5
1
1.5
2
2.5
0.5
1
1.5
2
2.5
1.4
1.4
1.3
1.3
12
1.2
1.11
1.1
0.5
1.5
2
2.5
3
0.5
1.5
2
2.5
hr
(c) Use calculus to determine analytically the time when the concentration is greatest.
t =
hr
Expert Solution
This question has been solved!
Explore an expertly crafted, step-by-step solution for a thorough understanding of key concepts.

This is a popular solution!

Trending now
This is a popular solution!

Step by step
Solved in 4 steps with 1 images

Recommended textbooks for you
College Algebra
Algebra
ISBN:
9781305115545
Author:
James Stewart, Lothar Redlin, Saleem Watson
Publisher:
Cengage Learning


Algebra & Trigonometry with Analytic Geometry
Algebra
ISBN:
9781133382119
Author:
Swokowski
Publisher:
Cengage
College Algebra
Algebra
ISBN:
9781305115545
Author:
James Stewart, Lothar Redlin, Saleem Watson
Publisher:
Cengage Learning
Algebra & Trigonometry with Analytic Geometry
Algebra
ISBN:
9781133382119
Author:
Swokowski
Publisher:
Cengage

Algebra and Trigonometry (MindTap Course List)
Algebra
ISBN:
9781305071742
Author:
James Stewart, Lothar Redlin, Saleem Watson
Publisher:
Cengage Learning

Big Ideas Math A Bridge To Success Algebra 1: Stu…
Algebra
ISBN:
9781680331141
Author:
HOUGHTON MIFFLIN HARCOURT
Publisher:
Houghton Mifflin Harcourt

Glencoe Algebra 1, Student Edition, 9780079039897…
Algebra
ISBN:
9780079039897
Author:
Carter
Publisher:
McGraw Hill