The correlation coefficient is r

Functions and Change: A Modeling Approach to College Algebra (MindTap Course List)
6th Edition
ISBN:9781337111348
Author:Bruce Crauder, Benny Evans, Alan Noell
Publisher:Bruce Crauder, Benny Evans, Alan Noell
Chapter5: A Survey Of Other Common Functions
Section5.3: Modeling Data With Power Functions
Problem 6E: Urban Travel Times Population of cities and driving times are related, as shown in the accompanying...

Related questions
Question
100%
Part 2 please
Transcribed Image Text:50-
50
100
150
200
250
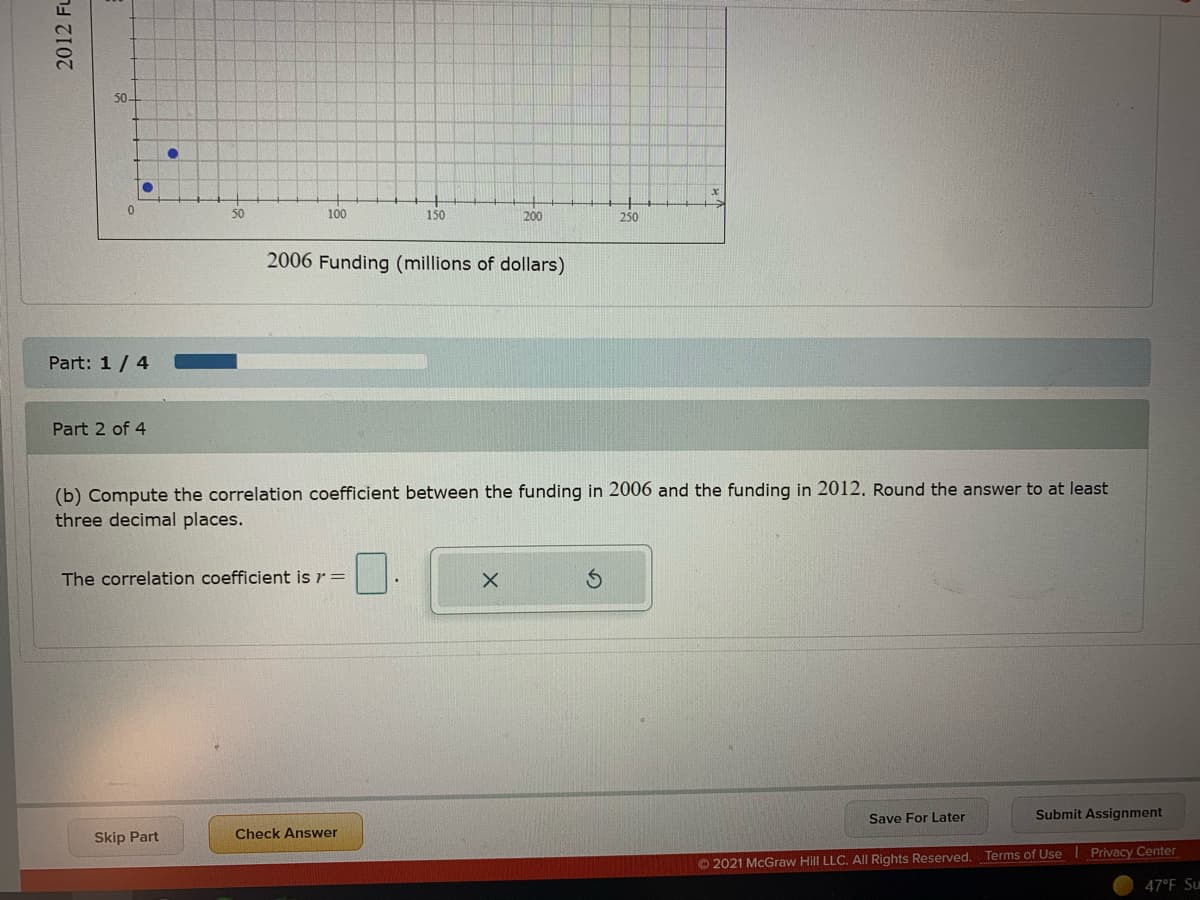
2006 Funding (millions of dollars)
Part: 1/ 4
Part 2 of 4
(b) Compute the correlation coefficient between the funding in 2006 and the funding in 2012. Round the answer to at least
three decimal places.
The correlation coefficient is r =
Save For Later
Submit Assignment
Check Answer
Skip Part
© 2021 McGraw Hill LLC. AlI Rights Reserved. Terms of Use Privacy Center
47°F Su
2012 FL
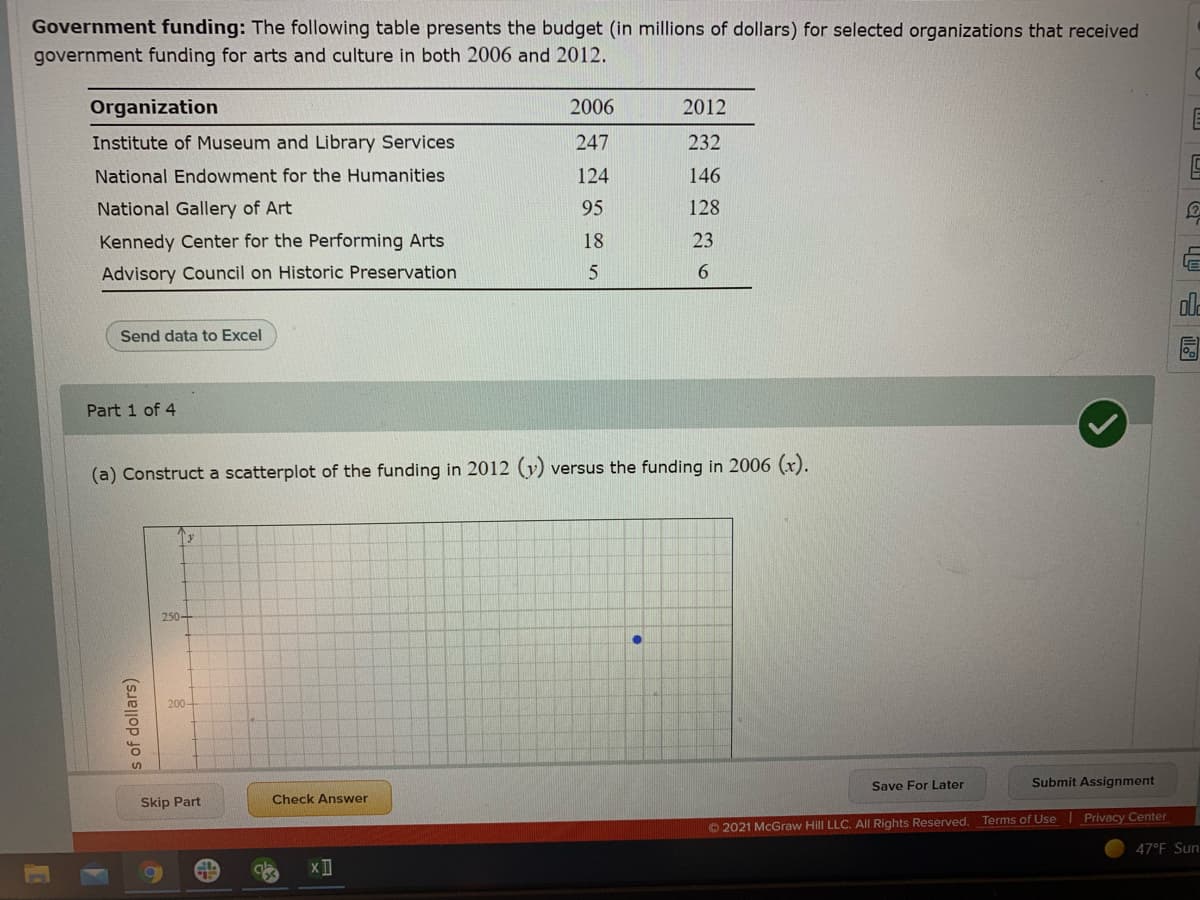
Transcribed Image Text:Government funding: The following table presents the budget (in millions of dollars) for selected organizations that received
government funding for arts and culture in both 2006 and 2012.
Organization
2006
2012
Institute of Museum and Library Services
247
232
National Endowment for the Humanities
124
146
National Gallery of Art
95
128
Kennedy Center for the Performing Arts
18
23
Advisory Council on Historic Preservation
ole
Send data to Excel
Part 1 of 4
(a) Construct a scatterplot of the funding in 2012 (y) versus the funding in 2006 (x).
Ty
250-
200
Save For Later
Submit Assignment
Skip Part
Check Answer
O 2021 McGraw Hill LLC. All Rights Reserved. Terms of Use Privacy Center
47°F Sun
s of dollars)
Expert Solution
This question has been solved!
Explore an expertly crafted, step-by-step solution for a thorough understanding of key concepts.

This is a popular solution!

Trending now
This is a popular solution!

Step by step
Solved in 2 steps with 2 images

Recommended textbooks for you
Functions and Change: A Modeling Approach to Coll…
Algebra
ISBN:
9781337111348
Author:
Bruce Crauder, Benny Evans, Alan Noell
Publisher:
Cengage Learning
Functions and Change: A Modeling Approach to Coll…
Algebra
ISBN:
9781337111348
Author:
Bruce Crauder, Benny Evans, Alan Noell
Publisher:
Cengage Learning