The data and graph above show the number of hours of daylight in Richmond VA for specific dates during 2018. x=t days after Jan. 1 and y = H(t) the number of hours of daylight on day t. Why are we using Cosine instead of Sine and use the data and the graph to estimate the value of A, the amplitude of the graph.
The data and graph above show the number of hours of daylight in Richmond VA for specific dates during 2018. x=t days after Jan. 1 and y = H(t) the number of hours of daylight on day t. Why are we using Cosine instead of Sine and use the data and the graph to estimate the value of A, the amplitude of the graph.

Algebra & Trigonometry with Analytic Geometry
13th Edition
ISBN:9781133382119
Author:Swokowski
Publisher:Swokowski
Chapter10: Sequences, Series, And Probability
Section10.8: Probability
Problem 31E

Related questions
Question
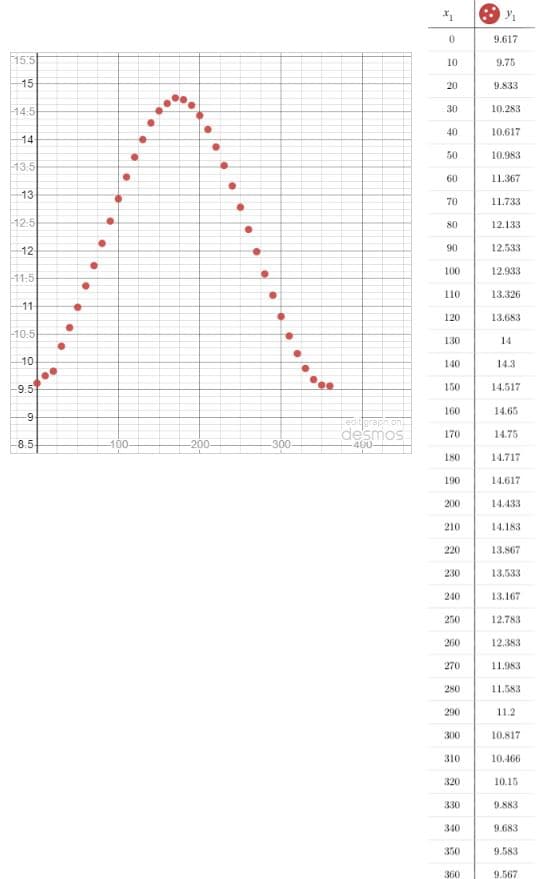
The data and graph above show the number of hours of daylight in Richmond VA for specific dates during 2018. x=t days after Jan. 1 and y = H(t) the number of hours of daylight on day t.
Why are we using Cosine instead of Sine and use the data and the graph to estimate the value of A, the amplitude of the graph.
Transcribed Image Text:9.617
15:5
9.75
10
15
20
9.833
30
10.283
14:5
40
10.617
14
50
10.983
13:5
60
11.367
13
70
11.733
12:5
80
12.133
12
90
12.533
100
12.933
11:5
110
13.326
11-
120
13.683
10:5
130
14
10
140
14.3
-9:5
150
14.517
160
14.65
9
graph on
desmos
400
170
14.75
100
-200-
300
8.5
180
14.717
190
14.617
200
14.433
210
14.183
220
13.867
230
13.533
240
13.167
250
12.783
260
12.383
270
11.983
280
11.583
290
11.2
300
10.817
310
10.466
320
10.15
330
9.883
340
9.683
350
9.583
360
9.567
Expert Solution
This question has been solved!
Explore an expertly crafted, step-by-step solution for a thorough understanding of key concepts.

This is a popular solution!

Trending now
This is a popular solution!

Step by step
Solved in 2 steps

Recommended textbooks for you
Algebra & Trigonometry with Analytic Geometry
Algebra
ISBN:
9781133382119
Author:
Swokowski
Publisher:
Cengage
Algebra & Trigonometry with Analytic Geometry
Algebra
ISBN:
9781133382119
Author:
Swokowski
Publisher:
Cengage