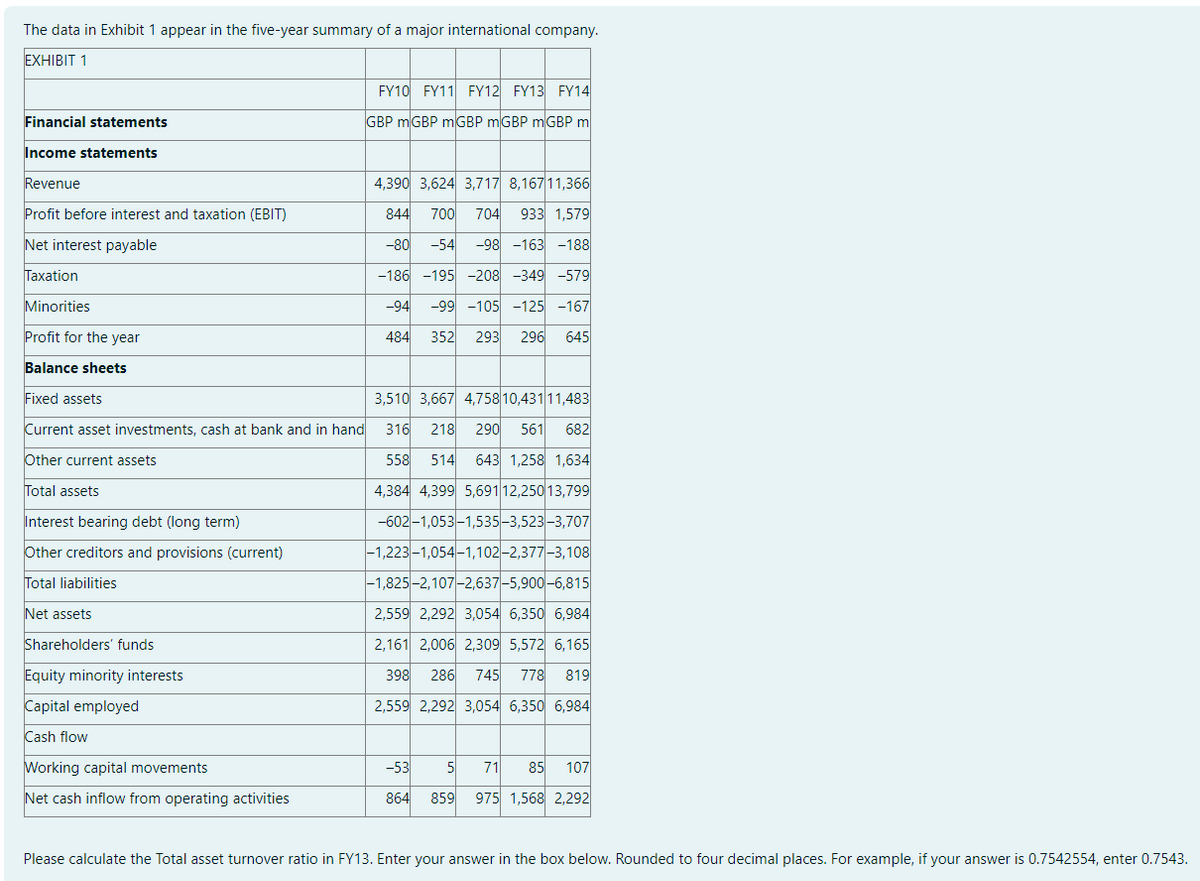
The data in Exhibit 1 appear in the five-year summary of a major international company. EXHIBIT 1 Financial statements FY10 FY11 FY12 FY13 FY14 GBP mGBP mGBP MGBP mGBP m Income statements Revenue 4,390 3,624 3,717 8,167 11,366 Profit before interest and taxation (EBIT) 844 700 704 933 1,579 Net interest payable Taxation Minorities -80 -54 -98 -163-188 -186 -195-208 -349-579 -94 -99-105-125-167 484 352 293 296 645 Profit for the year Balance sheets Fixed assets Current asset investments, cash at bank and in hand Other current assets Total assets Interest bearing debt (long term) Other creditors and provisions (current) Total liabilities Net assets Shareholders' funds Equity minority interests Capital employed Cash flow 3,510 3,667 4,758 10,431 11,483 316 218 290 561 682 558 514 643 1,258 1,634 4,384 4,399 5,691 12,250 13,799 -602-1,053-1,535-3,523-3,707 -1,223-1,054-1,102-2,377-3,108 -1,825-2,107-2,637-5,900-6,815 2,559 2,292 3,054 6,350 6,984 2,161 2,006 2,309 5,572 6,165 398 286 745 778 819 2,559 2,292 3,054 6,350 6,984 Working capital movements Net cash inflow from operating activities -53 864 5 71 85 107 859 975 1,568 2,292 Please calculate the Total asset turnover ratio in FY13. Enter your answer in the box below. Rounded to four decimal places. For example, if your answer is 0.7542554, enter 0.7543.
The data in Exhibit 1 appear in the five-year summary of a major international company. EXHIBIT 1 Financial statements FY10 FY11 FY12 FY13 FY14 GBP mGBP mGBP MGBP mGBP m Income statements Revenue 4,390 3,624 3,717 8,167 11,366 Profit before interest and taxation (EBIT) 844 700 704 933 1,579 Net interest payable Taxation Minorities -80 -54 -98 -163-188 -186 -195-208 -349-579 -94 -99-105-125-167 484 352 293 296 645 Profit for the year Balance sheets Fixed assets Current asset investments, cash at bank and in hand Other current assets Total assets Interest bearing debt (long term) Other creditors and provisions (current) Total liabilities Net assets Shareholders' funds Equity minority interests Capital employed Cash flow 3,510 3,667 4,758 10,431 11,483 316 218 290 561 682 558 514 643 1,258 1,634 4,384 4,399 5,691 12,250 13,799 -602-1,053-1,535-3,523-3,707 -1,223-1,054-1,102-2,377-3,108 -1,825-2,107-2,637-5,900-6,815 2,559 2,292 3,054 6,350 6,984 2,161 2,006 2,309 5,572 6,165 398 286 745 778 819 2,559 2,292 3,054 6,350 6,984 Working capital movements Net cash inflow from operating activities -53 864 5 71 85 107 859 975 1,568 2,292 Please calculate the Total asset turnover ratio in FY13. Enter your answer in the box below. Rounded to four decimal places. For example, if your answer is 0.7542554, enter 0.7543.

Essentials Of Investments
11th Edition
ISBN:9781260013924
Author:Bodie, Zvi, Kane, Alex, MARCUS, Alan J.
Publisher:Bodie, Zvi, Kane, Alex, MARCUS, Alan J.
Chapter1: Investments: Background And Issues
Section: Chapter Questions
Problem 1PS

Related questions
Question
Transcribed Image Text:The data in Exhibit 1 appear in the five-year summary of a major international company.
EXHIBIT 1
Financial statements
FY10 FY11 FY12 FY13 FY14
GBP mGBP mGBP MGBP mGBP m
Income statements
Revenue
4,390 3,624 3,717 8,167 11,366
Profit before interest and taxation (EBIT)
844 700 704 933 1,579
Net interest payable
Taxation
Minorities
-80 -54 -98 -163-188
-186 -195-208 -349-579
-94
-99-105-125-167
484 352 293 296 645
Profit for the year
Balance sheets
Fixed assets
Current asset investments, cash at bank and in hand
Other current assets
Total assets
Interest bearing debt (long term)
Other creditors and provisions (current)
Total liabilities
Net assets
Shareholders' funds
Equity minority interests
Capital employed
Cash flow
3,510 3,667 4,758 10,431 11,483
316 218 290 561 682
558
514 643 1,258 1,634
4,384 4,399 5,691 12,250 13,799
-602-1,053-1,535-3,523-3,707
-1,223-1,054-1,102-2,377-3,108
-1,825-2,107-2,637-5,900-6,815
2,559 2,292 3,054 6,350 6,984
2,161 2,006 2,309 5,572 6,165
398 286 745 778 819
2,559 2,292 3,054 6,350 6,984
Working capital movements
Net cash inflow from operating activities
-53
864
5 71 85 107
859
975 1,568 2,292
Please calculate the Total asset turnover ratio in FY13. Enter your answer in the box below. Rounded to four decimal places. For example, if your answer is 0.7542554, enter 0.7543.
AI-Generated Solution

Unlock instant AI solutions
Tap the button
to generate a solution
Recommended textbooks for you
Essentials Of Investments
Finance
ISBN:
9781260013924
Author:
Bodie, Zvi, Kane, Alex, MARCUS, Alan J.
Publisher:
Mcgraw-hill Education,


Essentials Of Investments
Finance
ISBN:
9781260013924
Author:
Bodie, Zvi, Kane, Alex, MARCUS, Alan J.
Publisher:
Mcgraw-hill Education,

Foundations Of Finance
Finance
ISBN:
9780134897264
Author:
KEOWN, Arthur J., Martin, John D., PETTY, J. William
Publisher:
Pearson,

Fundamentals of Financial Management (MindTap Cou…
Finance
ISBN:
9781337395250
Author:
Eugene F. Brigham, Joel F. Houston
Publisher:
Cengage Learning

Corporate Finance (The Mcgraw-hill/Irwin Series i…
Finance
ISBN:
9780077861759
Author:
Stephen A. Ross Franco Modigliani Professor of Financial Economics Professor, Randolph W Westerfield Robert R. Dockson Deans Chair in Bus. Admin., Jeffrey Jaffe, Bradford D Jordan Professor
Publisher:
McGraw-Hill Education