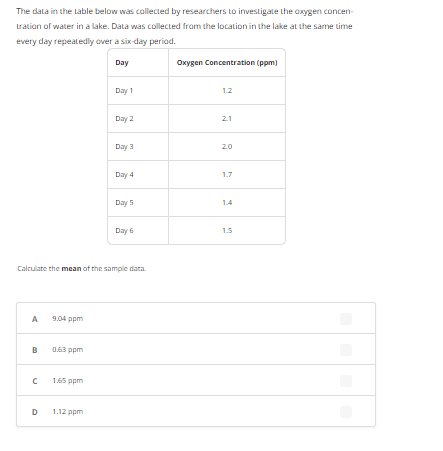
The data in the table below was collected by researchers to investigate the oxygen concen- tration of water in a lake. Data was collected from the location in the lake at the same time every day repeatedly over a six-day period. Day A B с D 9.04 ppm Calculate the mean of the sample data. 0.63 ppm 1.65 ppm Day 1 1.12 ppm Day 2 Day 3 Day 4 Day 5 Day 6 Oxygen Concentration (ppm) 1.2 21 20 1.7 1.4 1.5


Nutrient Cycle
The chemical nutrients that are essential for the synthesis of living matter are taken from the physical environment. After the death and decomposition of living organisms, they are returned to the environment to be used over and again. This cyclic back and forth regenerative movement of chemical elements between organisms and their physical environment is known as the biogeochemical cycle or nutrient cycle. Since these elements serve as the essential chemical nutrients of organisms, their cyclic movements are also called nutrient cycling or mineral cycling. Minerals are not uniformly distributed all over the ecosystems but are more concentrated in specific compartments, called pools. The major biogeochemical cycles include the water cycle, nitrogen cycle, carbon cycle, phosphorus cycle, calcium cycle, sulfur cycle, etc.
Biosphere
The geologist Eduard Sues coined the term biosphere. The biosphere is characterized as a part of the earth, which includes ground and air. Moreover, the organisms on earth live in the biosphere. The biosphere is a confined area on the earth's surface where water, soil, and air combine to promote life. Several different types of life exist here.

Step by step
Solved in 2 steps


