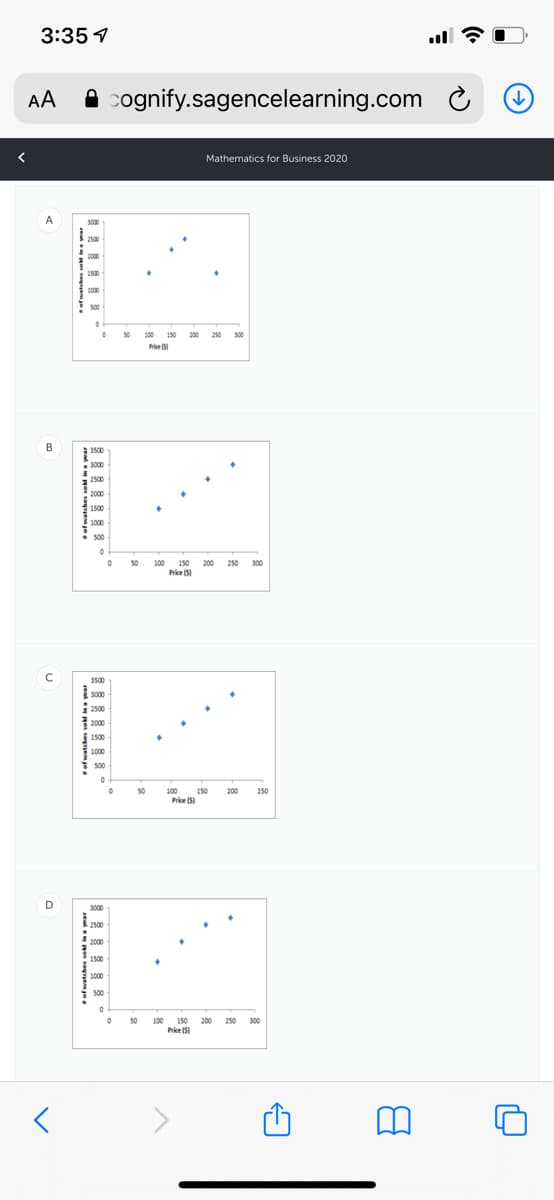
The data on the price of watches (in dollars) and the number of watches sold in a particular year is plotted in each of the four graphs provided. Which plot would most appropriately be modeled using a quadratic equation?
Q: Determine the equation of the midline of the following graph. 5 4 3 2.
A: Midline is calculated asymax-ymin2 Ymax = -1 Ymin = -3
Q: Graph the following quadratic equation: f (x)= 2x^2+12x+10
A:
Q: Without a calculator, sketch the graph of: S(x) = -x° + 4x³ – 5x – 2
A: Given function is : fx=-x5+4x3-5x-2 To sketch the graph of a given function.
Q: Find the vertex of the parabola which is the graph of f(x) =3x2+5x-2 without a calculator.
A:
Q: Write a possible equation for the graphs below: a) 2 1 -3 b)
A: Possible equation of the graphs
Q: Find a formula for the quadratic function depicted in the following graph.
A:
Q: Sketch and identify the graph of the following equations in R3: 16x2 + 25y2 = 100
A: Topic = Geometry The graph is cylinder in R3
Q: graph the following quadratic equation x(x+6)
A: We have to draw the graph of quadratic equation: xx+6 Here if we look at equation then we can see…
Q: a. y = x² – 2x – 8 y 2.
A: Consider the given quadratic equation y=x2-2x-8 To plot a graph, make a table of values by assuming…
Q: Can you please explain to me why the the attached screenshot is not just X=-2<x<4 Where does…
A: 1x2-2x-8x2-2x-8 = 0⇒(x-4)(x+2) = 0⇒x = 4 /-2∴1x2-2-8 = 1(x-4)(x+2) ........ *Note that .....*…
Q: If 1 - 2, b2 is a point on the graph of 2x + 3y = 2, what is b?
A: Given equation of graph 2x+3y=2......(1)
Q: Give the domain and the range of the quadratic function whose graph is described as : The vertex is…
A: Explanation: Given that, Vertex of the parabola is (-3,-4) Parabola opens downward.
Q: Based on the difference in y-values, identify the graph as linear, quadratic, exponential, or…
A: Plotting the values on x-y plane we see that the following result. The curve will proceed and cut…
Q: write the equation of a graph that has the shape of y = under square root x but has been reflected…
A:
Q: how to graph the equation 2x+5y=10
A: The given equation is a linear equation. Hence it represents a straight line.For plotting a straight…
Q: Graph at least 6 members of each family of solutions. 1. y' = 0.1y?
A:
Q: Find the intercepts of the graph of h(x) = 3 | x + 2 | - 1.
A: The x-intercept of a graph is a point where the graph meets the x-axis. The y-intercept is the point…
Q: Which of the graphs below correctly solves for x in the equation -x²-3x - 1 = -x-4? 10 A O -10-8-6…
A:
Q: Draw the graph of a quadratic function that has a vertex at (−2,5) and has a y-intercept of 3. Make…
A: Quadratic function and it's graph
Q: Find an equation for the graph shown to the right. ...
A:
Q: 3. Explore with your calculator to find equations that give the following graphs. b. a.
A:
Q: Find the equation of the graph of all points which are three times as far from A(3, – 1,2) as far…
A:
Q: 1. 9x2 + 4y2 = 36 2.222² 쫑 = 1
A: Given: 1). 9x2+4y2=36 2). z2-x2-y24=1 For sketching the graphs of given expression in ℝ3 have to…
Q: The graph of the quadratic function f(x) = −2x² - 4x + 6 is shown. + -2 8 6 4 2 -2 -4 -6 -8 DA → 2 4…
A:
Q: Based on the difference in y-values, identify the graph as linear, quadratic, exponential, or…
A: Given data
Q: 3x²+2x-2 x² + 4x-5
A: The Solution is given below
Q: The graph shown matches which quadratic equation?
A: Clearly from the graph we can see that; y(0) = (-3)
Q: Explain the difference between the graphs of the two equations. 4x + 9y = 36 4x + 9y = 36
A:
Q: How many times does the graph of y = ax + b with a + 0 intersect the x-axis?
A: Given that, y=ax+b
Q: Find an equation for the graph sketched below 5 -5 -4 -3 -2 -1 /1 2 3 4 5 -4 -5 -6 -7 -8
A:
Q: What is the Equation of the graph drawn above. 11T 7x 4 3n 3
A: (1) In the given figure, There is a circle of radius 3, so, in polar coordinates the equation of…
Q: Determine the equation of the midline of the following graph. 5. 4 3 1 -37 -31 бл 15T 9 -1 -2 -3
A: To find the equation of the mid line
Q: Find a formula for the quadratic function whose graph is shown. y X 15 f(x) = -5 30 20 10 f 5 (5,2)…
A:
Q: 5) y= 3x – 4 1 y =--x+3 2 Answer:
A:
Q: Graph the following quadratic relation y = -;(x – 1)² + 2 without using a table of values. Include…
A: Given relation is, y=-1/2(x-1)2+2
Q: Graph each of the following quadratics (a) y = (x – 3)² - 8 %3D
A: Note: Sorry for the inconvenience, but as per the Bartleby guidelines, we cannot answer any…
Q: Find an equation for the graph sketched below: 7- 6. 5 4 -3 -2 --1 -2
A: NOTE: Refresh your page if you can't see any equations. . the exponential function is in the form of…
Q: Based on the difference in y-values, identify the graph as linear, quadratic, exponential, or…
A:
Q: Find the equation of the quadratic function g whose graph is shown below. («) - 0 (2,-1) (-1,-4)
A:
Q: Without a calculator, sketch the graph of: S(x) =-x* + 4x³ – 5x – 2
A:
Q: Should this table be graphed as linear, quadratic or exponential?
A:
Q: Write an equation for the quadratic graphed belov x-intercepts: (-1,0) and (4,0). y-intercept: (0,2)…
A:
Q: If (a, b) is a point on the graph of 2x + 3y = 6, write an equation that relates a to b.
A: Given a function relating two variables the value of the independent variable can be determined by…
Q: 10. Describe the graph of the equation - x² + 4y – 4x + 40y + 60 = 0.
A:
Q: Again, the function y=x is shown below. Graph each of the following more complicated quadratics…
A: Solution
Q: Use a graphing utility to graph the equation 7x2 + 8xy + y2 - 1 = 0.
A:
Q: Determine the equation of the midline of the following graph. 4 1 31 -1 -2 3 -4 -5 3. 2.
A: The midline is a horizontal line at which half of the function's graph lies above the midline and…
Q: Find a quadratic equation that fits this set of data points: (0,-5) (3,4) (9,4)
A:
Trending now
This is a popular solution!
Step by step
Solved in 2 steps with 4 images
- Which model—the one for parliaments or the one for ministries (or cabinets)—presented in the article has the greater explanatory power? How can you tell?The data given is shown below 40 40 43 46 44 49 51 54 46 51 47 49 49 45 45 44 45 41 49 52 51 54 50 51 41 52 53 50 46 56 42 42 40 42 49 47 51 48 46 57 48 55 49 46 57 44 49 43 44 43 51 48 48 46 49 Class width = 6 Find the following: A. Decile (5th) B. Quartile (2nd) C. Skewness D. KurtosisA paper investigated the driving behavior of teenagers by observing their vehicles as they left a high school parking lot and then again at a site approximately 1 2 mile from the school. Assume that it is reasonable to regard the teen drivers in this study as representative of the population of teen drivers. MaleDriver FemaleDriver 1.4 -0.2 1.2 0.5 0.9 1.1 2.1 0.7 0.7 1.1 1.3 1.2 3 0.1 1.3 0.9 0.6 0.5 2.1 0.5 (a) Use a .01 level of significance for any hypothesis tests. Data consistent with summary quantities appearing in the paper are given in the table. The measurements represent the difference between the observed vehicle speed and the posted speed limit (in miles per hour) for a sample of male teenage drivers and a sample of female teenage drivers. (Use ?males − ?females. Round your test statistic to two decimal places. Round your degrees of freedom down to the nearest whole number. Round your p-value to three decimal places.) t = df =…
- In the Chernobyl nuclear accident it is estimated that 30,000 people received an average dose of 45 REM. For this population, using the linear hypothesis, how many "normal" deaths from cancer are expected and how many additional deaths from the radiation of the accident? Group of answer choices 500 normal, 6000 additional 1000 normal, 4000 additional 2000 normal, 3000 additional 4000 normal, 1000 additional 6000 normal, 500 additionalAn industry trade publication stated that the average profit per customer for this industry was at least $4500. Using a test of hypothesis, do the data support this claim or not Customer Percent Gross Profit Gross Sales Gross Profit Industry Code Competitive Rating* 1 51.0% $170.00 $86.70 1 2 2 32.0% $181.00 $57.92 3 4 3 20.0% $203.00 $40.60 2 2 4 22.0% $249.00 $54.78 5 1 5 21.0% $476.00 $99.96 5 1 6 21.0% $476.00 $99.96 5 4 7 22.0% $635.00 $139.70 2 3 8 34.0% $856.00 $291.04 3 3 9 26.0% $1,062.00 $276.12 4 2 10 16.6% $1,110.00 $183.71 7 3 11 20.0% $1,153.00 $230.60 7 3 12 36.0% $1,392.00 $501.12 4 2 13 18.0% $1,743.00 $313.74 4 2 14 20.0% $2,307.00 $461.40 7 3 15 5.0% $2,534.00 $126.70 4 5 16 29.0% $2,683.00 $778.07 7 2 17 10.0% $2,780.00 $278.00 2 3 18 37.0% $3,272.00 $1,210.64 5 3 19 60.0% $3,864.00 $2,318.40 7 1 20 24.0% $3,988.00 $957.12 6 3 21 9.0% $4,072.00 $366.48 7 3 22 50.0% $4,190.00 $2,095.00 5 3 23 17.0% $4,219.00 $717.23 3…A paper investigated the driving behavior of teenagers by observing their vehicles as they left a high school parking lot and then again at a site approximately 1 2 mile from the school. Assume that it is reasonable to regard the teen drivers in this study as representative of the population of teen drivers. Amount by Which Speed Limit Was Exceeded MaleDriver FemaleDriver 1.2 -0.1 1.4 0.4 0.9 1.1 2.1 0.7 0.7 1.1 1.3 1.2 3 0.1 1.3 0.9 0.6 0.5 2.1 0.5 (a) Use a .01 level of significance for any hypothesis tests. Data consistent with summary quantities appearing in the paper are given in the table. The measurements represent the difference between the observed vehicle speed and the posted speed limit (in miles per hour) for a sample of male teenage drivers and a sample of female teenage drivers. (Use μmales − μfemales.Round your test statistic to two decimal places. Round your degrees of freedom down to the nearest whole number. Round your p-value to…
- The article “Effect of Varying Solids Concentration and Organic Loading on the Performance of Temperature Phased Anaerobic Digestion Process” (S. Vandenburgh and T. Ellis, Water Environment Research, 2002:142–148) discusses experiments to determine the effect of the solids concentration on the performance of treatment methods for wastewater sludge. In the first experiment, the concentration of solids (in g/L) was 43.94 ± 1.18. In the second experiment, which was independent of the first, the concentration was 48.66 ± 1.76. Estimate the difference in the concentration between the two experiments, and find the uncertainty in the estimate.A paper investigated the driving behavior of teenagers by observing their vehicles as they left a high school parking lot and then again at a site approximately 1 2 mile from the school. Assume that it is reasonable to regard the teen drivers in this study as representative of the population of teen drivers. Amount by Which Speed Limit Was Exceeded MaleDriver FemaleDriver 1.3 -0.1 1.3 0.4 0.9 1.1 2.1 0.7 0.7 1.1 1.3 1.2 3 0.1 1.3 0.9 0.6 0.5 2.1 0.5 (a) Use a .01 level of significance for any hypothesis tests. Data consistent with summary quantities appearing in the paper are given in the table. The measurements represent the difference between the observed vehicle speed and the posted speed limit (in miles per hour) for a sample of male teenage drivers and a sample of female teenage drivers. (Use μmales − μfemales.Round your test statistic to two decimal places. Round your degrees of freedom down to the nearest whole number. Round your p-value to…The spike stature of the plants grown from the seeds of the porcine separates (Dactylis glomerata L) collected from the University campus and İbradı Eynif pasture are given below. In this plant, compare whether there is a difference between regions in terms of spike height. Virgo Height (cm) Data obtained from plants collected from university campus 5 6 8 7 8 6 5 5 4 6 6 Data obtained from plants collected from Eynif pasture 12 9 11 9 9 11 9 10 11 10 Note: Your results interpretation according to two different possibilities (Do it separately, assuming that it is 0.07 and 0.04).
- An article reported data from a study in which both a baseline gasoline mixture and a reformulated gasoline were used. Consider the following observations on age (yr) and NOx emissions (g/kWh): Engine 1 2 3 4 5 6 7 8 9 10 Age 0 0 2 11 7 16 9 0 12 4 Baseline 1.74 4.38 4.04 1.23 5.30 0.58 3.35 3.44 0.73 1.23 Reformulated 1.85 5.93 5.52 2.67 6.54 0.76 4.94 4.87 0.69 1.39 Construct scatter plots of the baseline NOx emissions versus age. Construct scatter plots of the reformulated NOx emissions versus age. What appears to be the nature of the relationship between these two variables? As age increases, emissions also increase.As age increases, emissions decrease. There is no compelling relationship between the data.An article reported data from a study in which both a baseline gasoline mixture and a reformulated gasoline were used. Consider the following observations on age (yr) and NOx emissions (g/kWh): Engine 1 2 3 4 5 6 7 8 9 10 Age 0 0 2 11 7 16 9 0 12 4 Baseline 1.70 4.38 4.06 1.24 5.29 0.59 3.35 3.45 0.73 1.22 Reformulated 1.86 5.91 5.51 2.70 6.50 0.71 4.95 4.86 0.72 1.41 Construct scatter plots of the baseline NOx emissions versus age. What appears to be the nature of the relationship between these two variables? There is no compelling relationship between the data. As age increases, emissions also increase. As age increases, emissions decrease.given this data, what will be the most appropriate way to present them?