The data shown below for the dependent variable, y, and the independent variable, x, have been collected using simple random sampling. 31.6 5.8 14.4 24.8 19.1 11 8.8 14.4 25.8 27.5 . Develop a simple linear regression equation for these data. 8.4 - 6.1 29.6 15.4 2.7 23.5 y . Determine the predicted y value when x = 10. . Estimate the change in the y variable resulting from the increase in the x variable of 8 units.
The data shown below for the dependent variable, y, and the independent variable, x, have been collected using simple random sampling. 31.6 5.8 14.4 24.8 19.1 11 8.8 14.4 25.8 27.5 . Develop a simple linear regression equation for these data. 8.4 - 6.1 29.6 15.4 2.7 23.5 y . Determine the predicted y value when x = 10. . Estimate the change in the y variable resulting from the increase in the x variable of 8 units.

College Algebra
7th Edition
ISBN:9781305115545
Author:James Stewart, Lothar Redlin, Saleem Watson
Publisher:James Stewart, Lothar Redlin, Saleem Watson
Chapter1: Equations And Graphs
Section: Chapter Questions
Problem 10T: Olympic Pole Vault The graph in Figure 7 indicates that in recent years the winning Olympic men’s...

Related questions
Topic Video
Question
100%
Please help me
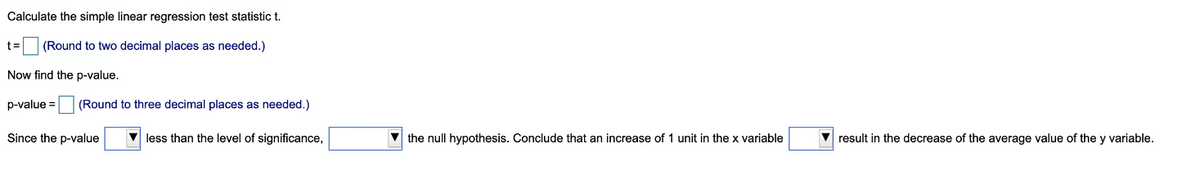
Transcribed Image Text:Calculate the simple linear regression test statistic t.
t=
(Round to two decimal places as needed.)
Now find the p-value.
p-value =
(Round to three decimal places as needed.)
Since the p-value
less than the level of significance,
V the null hypothesis. Conclude that an increase of 1 unit in the x variable
V result in the decrease of the average value of the y variable.
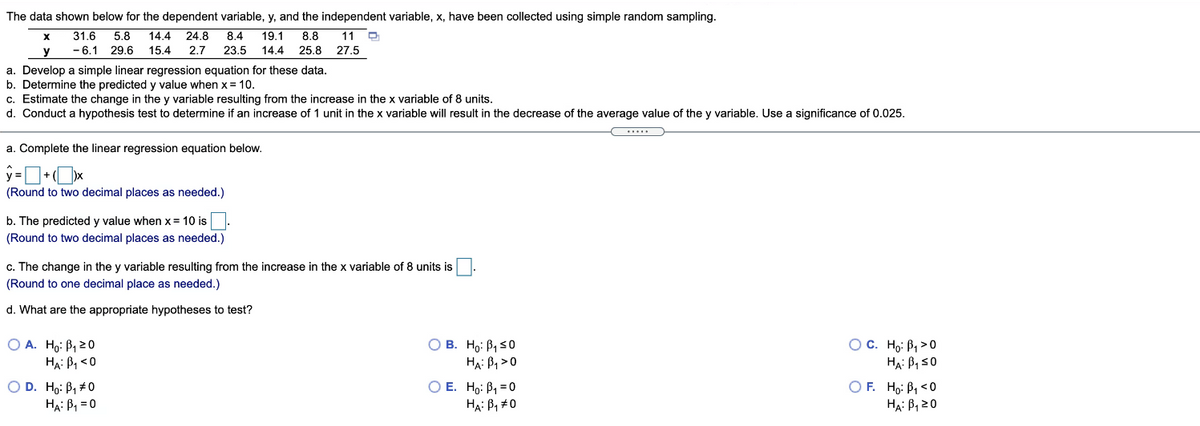
Transcribed Image Text:The data shown below for the dependent variable, y, and the independent variable, x, have been collected using simple random sampling.
11 O
31.6
5.8
14.4
24.8
8.4
19.1
8.8
- 6.1 29.6
15.4
2.7
23.5
14.4
25.8
27.5
a. Develop a simple linear regression equation for these data.
b. Determine the predicted y value when x = 10.
c. Estimate the change in the y variable resulting from the increase in the x variable of 8 units.
d. Conduct a hypothesis test to determine if an increase of 1 unit in the x variable will result in the decrease of the average value of the y variable. Use a significance of 0.025.
a. Complete the linear regression equation below.
(Round to two decimal places as needed.)
b. The predicted y value when x= 10 is
(Round to two decimal places as needed.)
c. The change in the y variable resulting from the increase in the x variable of 8 units is
(Round to one decimal place as needed.)
d. What are the appropriate hypotheses to test?
O A. Ho: B, 20
HA: P, <0
O B. Ho: B, 50
HẠ: B, >0
O E. Ho: B, =0
HẠ: B, #0
O C. Ho: B, >0
HẠ: BI S0
O F. Ho: P, <0
Hạ: B, 20
O D. Ho: B, #0
HẠ: B, = 0
Expert Solution
This question has been solved!
Explore an expertly crafted, step-by-step solution for a thorough understanding of key concepts.

Step by step
Solved in 5 steps with 1 images

Knowledge Booster


Learn more about
Need a deep-dive on the concept behind this application? Look no further. Learn more about this topic, probability and related others by exploring similar questions and additional content below.Recommended textbooks for you
College Algebra
Algebra
ISBN:
9781305115545
Author:
James Stewart, Lothar Redlin, Saleem Watson
Publisher:
Cengage Learning

Glencoe Algebra 1, Student Edition, 9780079039897…
Algebra
ISBN:
9780079039897
Author:
Carter
Publisher:
McGraw Hill
College Algebra
Algebra
ISBN:
9781305115545
Author:
James Stewart, Lothar Redlin, Saleem Watson
Publisher:
Cengage Learning
Glencoe Algebra 1, Student Edition, 9780079039897…
Algebra
ISBN:
9780079039897
Author:
Carter
Publisher:
McGraw Hill